MATH 2565 Lecture Notes - Scatter Plot, Dependent And Independent Variables

10 Jan 2013
School
Department
Course
Professor
Document Summary
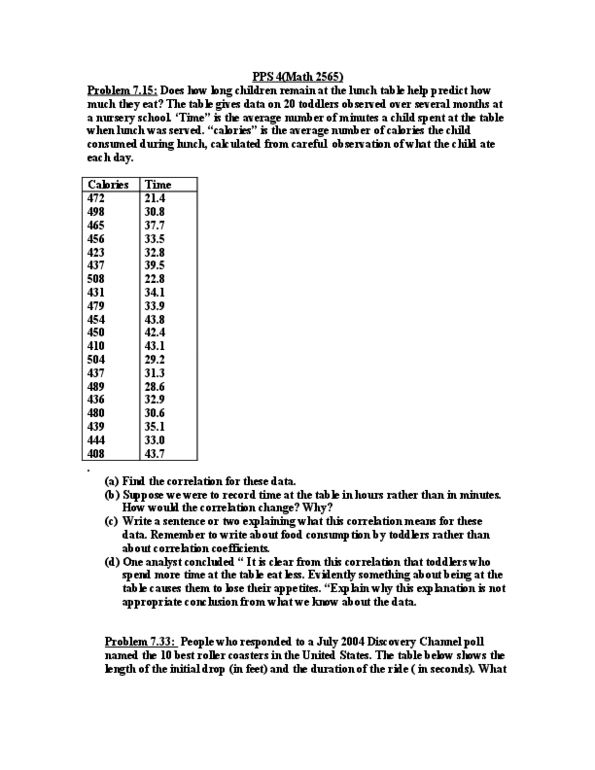
Problem 7. 15: lunchtime: the correlation between time toddlers spent at the table and the number of calories consumed by the toddlers is r. If time spent at the table were recorded in hours instead of minutes, the correlation would not change at all. Toddlers who spent more time at the table tended to consume fewer calories. There are many possible explanations for the behaviour of the toddlers. The data merely show us an association between time spent at the table and calories consumed by toddlers, and association is not the same thing as a cause-and- effect relationship. The scatterplot at the right shows that the association between drop and duration is straight, positive, and weak, with no outliers. Generally, rides on coasters with a greater initial drop tend to last somewhat longer. The correlation between drop and duration is 0. 35, indicating a weak association. Problem 8. 1: regression equations. x: 10, 2, 12, 2. 5 sx.