STAB22H3 Chapter Notes - Chapter 4: Quartile, Squared Deviations From The Mean, Interquartile Range


38
STAB22H3 Full Course Notes
Verified Note
38 documents
Document Summary
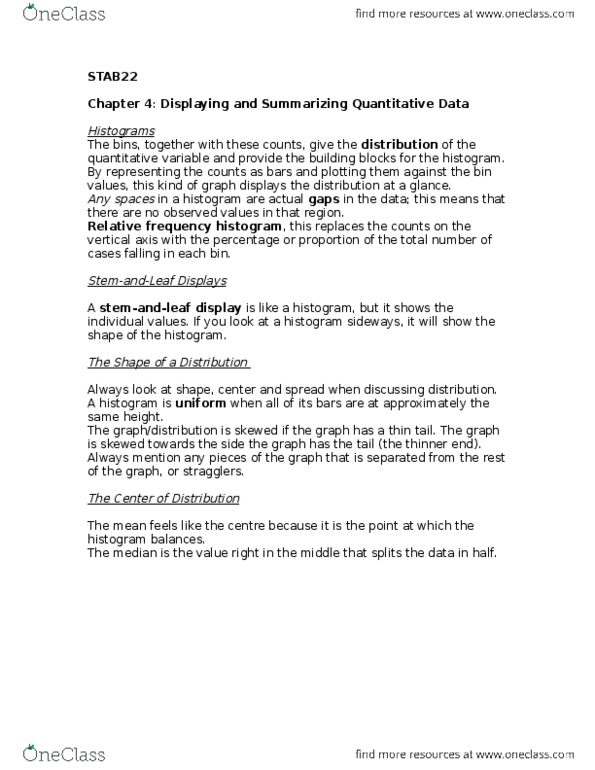
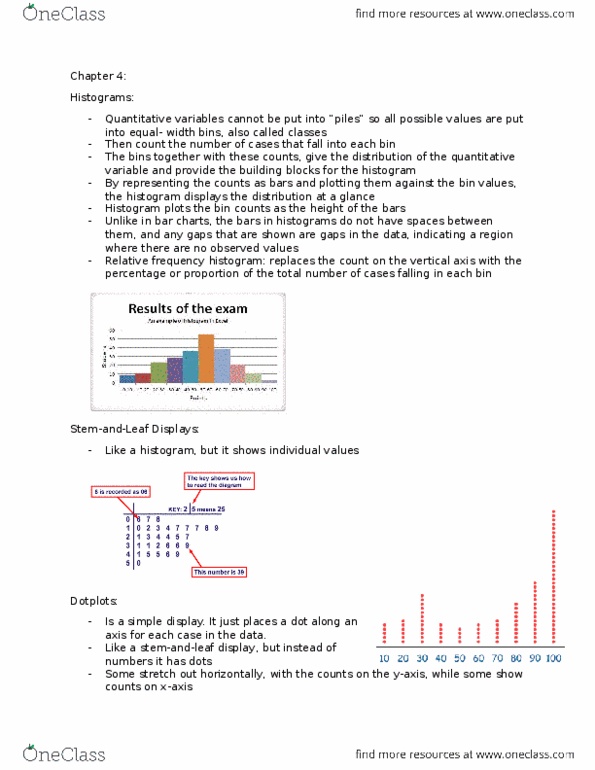
Chapter 4 displaying and summarizing quantitative data. For quantitative variables, there is no obvious way to choose piles so all the possible values are divided into bins/classes and then the number of cases in each bin/class is counted. The classes and the counts give the distribution of the quantitative variable. The histogram displays the distribution at a glance. Making histograms: aim for 6-10 bins for smaller data sets and 10-25 bins for larger data sets. Spaces in a histogram are actual gaps in the data (regions where there are no observed values), whereas in bar graphs, there are spaces between the bars to separate the counts of the different categories. Relative frequency histogram replaces the counts with the percentage or proportion of the total number of cases in each bin/class (shape of histogram will be the same) Like a histogram, but shows the individual values of the data.