BIO120H1 Lecture 2: Lecture 2 Notes.pdf


36
BIO120H1 Full Course Notes
Verified Note
36 documents
Document Summary
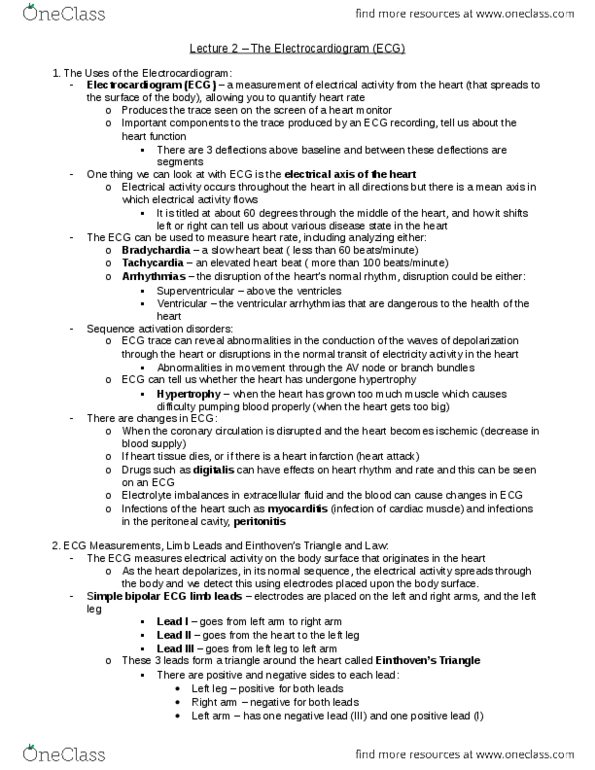
Lecture 2: the electrocardiogram (ecg: uses of the electrocardiogram. Thus, the ecg is a powerful diagnostic tool. The electrocardiogram produces the well-know trace seen on the screen of a heart monitor. There are several important components to the trace produced by an ecg recording: there are generally three deflections above baseline, and there are also segments between deflections - and all of these tell us about heart function. One of the things we can look at with an ecg is the electrical axis of the heart, which we will talk about more in the next lecture. The ecg can also be used to measure heart rate, including analysing either bradychardia (a slow heart beat) or tachycardia (an elevated one). We will look also at arrhythmias, and we will see how the heart has a normal rhythm that can be disrupted.