BUS 100 Study Guide - Linear Equation, Graphing Calculator, Cartesian Coordinate System

Document Summary
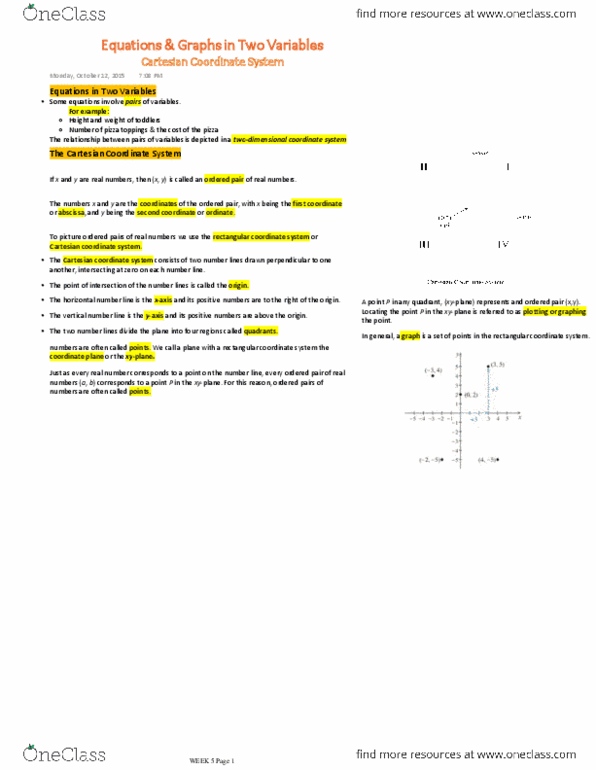
A graph may be regarded as a pictorial representation of data. A graph may be drawn manually on paper, or by using software on a graphing calculator or computer. Graphs, especially of functions are mostly drawn on a rectangular co-ordinate plane. A rectangular co-ordinate plane is formed by the intersection of two number lines. One, on the east-west directions is called the horizontal axis, and the other on the. The horizontal and vertical axis, make up the co-ordinate axis, and divide the co-ordinate plane into four regions called quadrants (fig. The horizontal co-ordinate is the number on the horizontal axis, and the vertical co-ordinate is the number on the vertical axis associated with the point on the co-ordinate plane. vertical axis. 2) the points a, b, c, d are also indentified by the attached pair of numbers. The ordered pairs (2, 3), (-5, 4), (-3. 5, -6), (3,-2. 5) are the points attached.