PHYS 242 Lecture 19: PHYS242_Lecture_19-21

13 May 2017
School
Department
Course
Professor
Document Summary
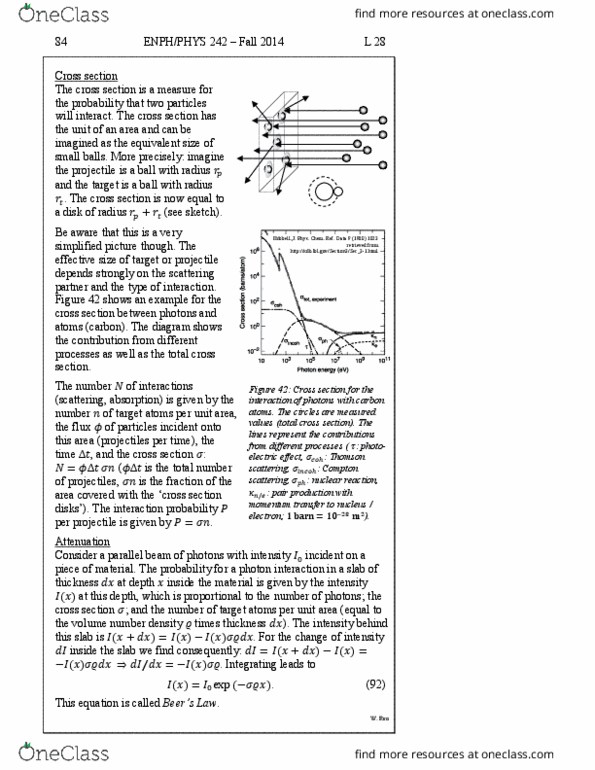
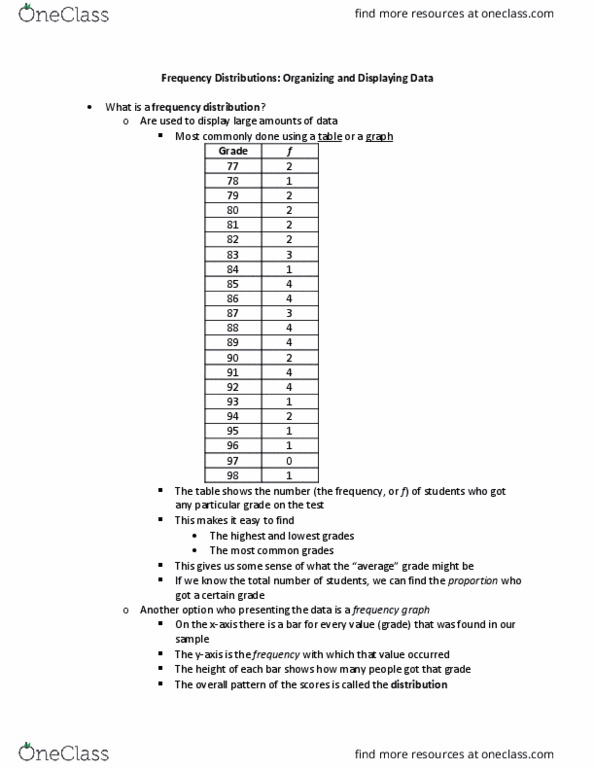
Before we continue to discuss the statistical approach to physical phenomena here is a little reminder about some of the basic tools. As an example we use the midterm results from a few years back. that this bar represents 16 students (or even more, because we would. The diagram in figure 28 shows how many students reached a given percentage in the midterm. The (cid:1876)-axis shows the percentage, the (cid:1877)- axis shows the number of students. For (cid:889)(cid:882) % e. g. we find 8 students, but for (cid:889)(cid:883) % we find also 8 students. This does not mean however, find the same number for all values between (cid:888)(cid:889). (cid:887) % and (cid:889)(cid:884). (cid:887) %). This bar represents exactly those 8 students that achieved more than (cid:888)(cid:889). (cid:887) % but not more than (cid:889)(cid:884). (cid:887) %. The (cid:1877)-axis label is consequently # of students / ((cid:887) % bin) . exam. The (cid:2206)-axis shows the percentage, the (cid:2207)-axis indicates.