QMS 102 Lecture : Module 3.pdf

8 Apr 2013
School
Department
Course
Professor
Document Summary
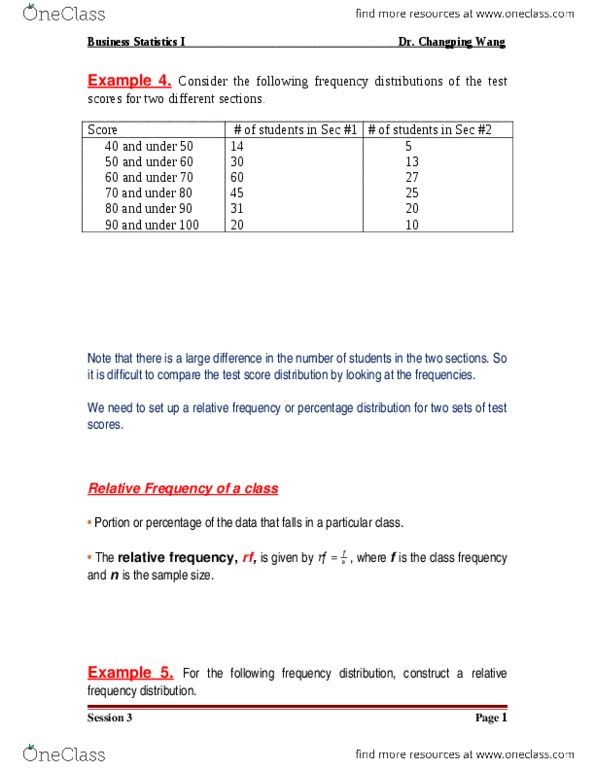
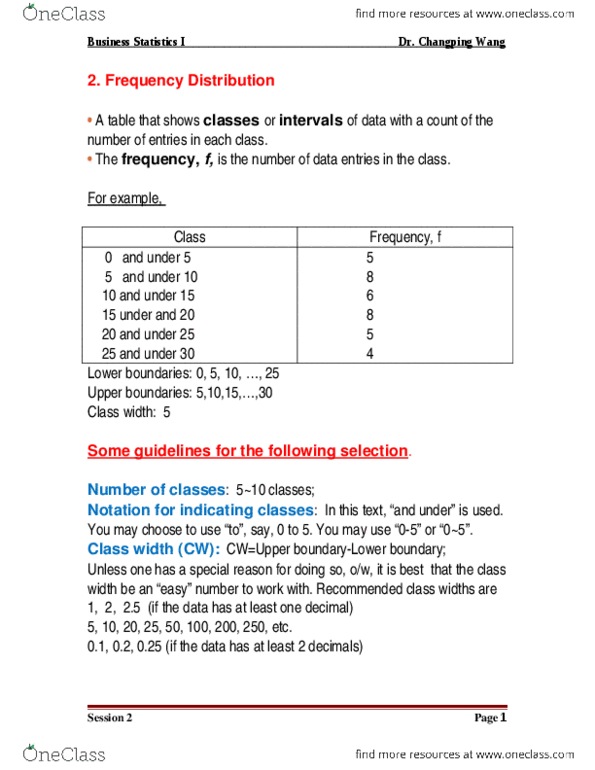
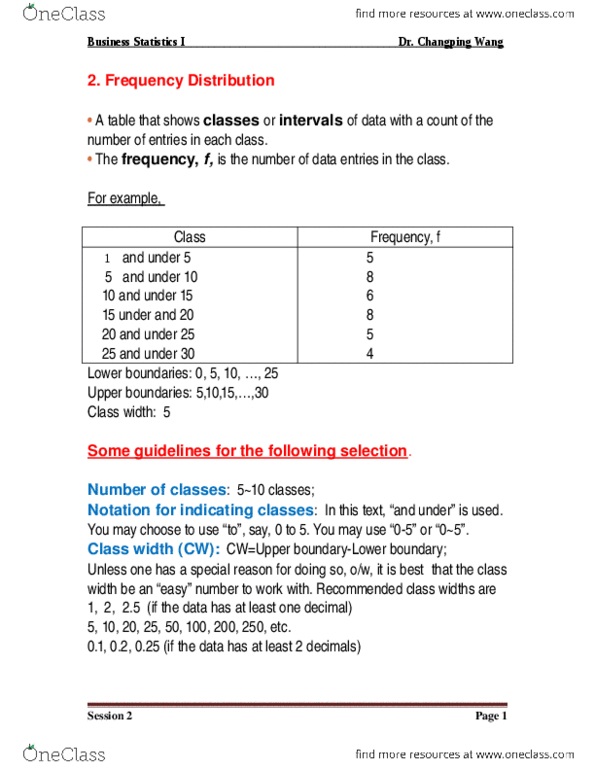
By the end of this module, you will be able to. Blackboard learn: construct a frequency distribution, construct a relative frequency distribution, construct a percentage frequency distribution table. A frequency distribution is a table that grouped the raw data of quantitative type into class intervals or range of values. Example: frequency distribution of marks of a statistics test. Class intervals are ranges of values having equal widths. There are several possible notations that are used to designate the classes. Class width (denotes as cw) is the difference between the upper and lower boundaries of any class. The class width is determined by the formula: The numerical values used in designating the classes when using the and under" notation" are called boundaries. https://courses. ryerson. ca/webapps/portal/frameset. jsp?tab_tab_group_id=_15_1&url=%2fwebapps%2fblackboard%2fexecute%2flauncher%3ftype%3dcou 1/20. The maximum value of a class interval is called the upper boundaries. The upper boundary of one class becomes a lower boundary of the next class. Number of data values which fall inside a class.