Sociology 2205A/B Chapter Notes - Chapter 3: Statistical Inference, Quartile, Interquartile Range

4 May 2013
School
Department
Course
Professor

Document Summary
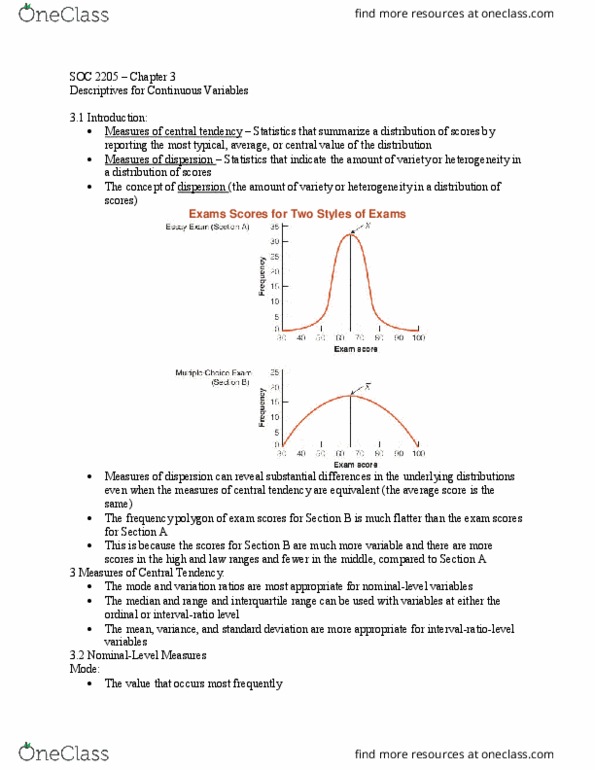
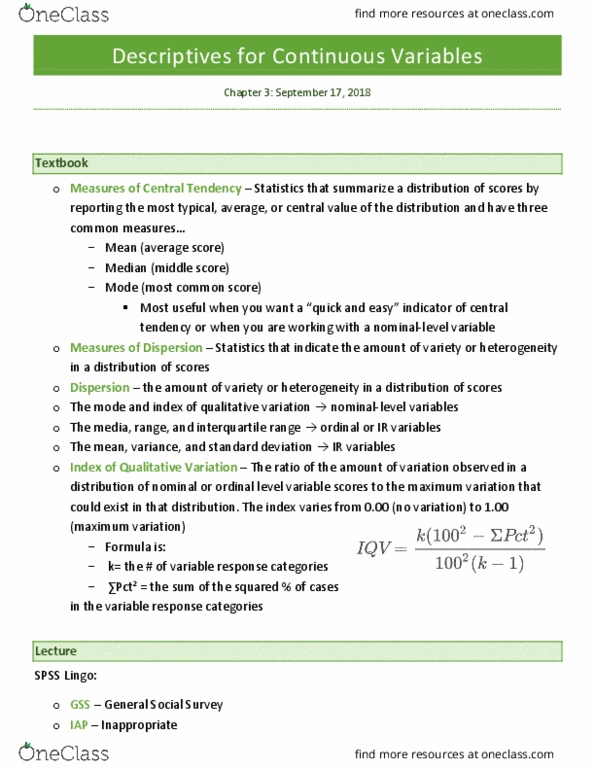
Frequency distributions, graphs, and chart summarize overall shape of distribution of scores in a comprehensive way. Need to show the average or typical case in the distribution measures of central tendency. Also how much variety or heterogeneity there is in distribution measures of dispersion. Three common measures of central tendency mean (average score), mode (most common score), median (middle case) Measures of dispersion provide information about variety, diversity, or heterogeneity. Mode is the score that appears the most. Most useful when you want a quick and easy indicator at central tendency or when you are working with nominal level variables. Some have no modes at all, or so many that it loses meaning. With ordinal and interval ratio data, mode may not be most common/typical. To conveniently measure dispersion of variable we can use a statistic based on the mode called the variation ratio (v)