ADMS 2320 Lecture Notes - Exit Poll, Cumulative Frequency Analysis, Frequency Distribution

14 Jul 2013
School
Department
Course
Professor
Document Summary
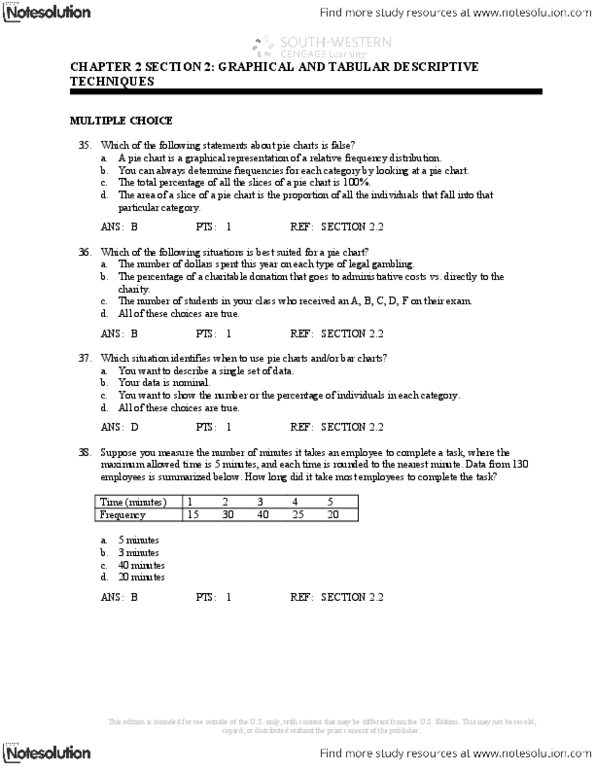
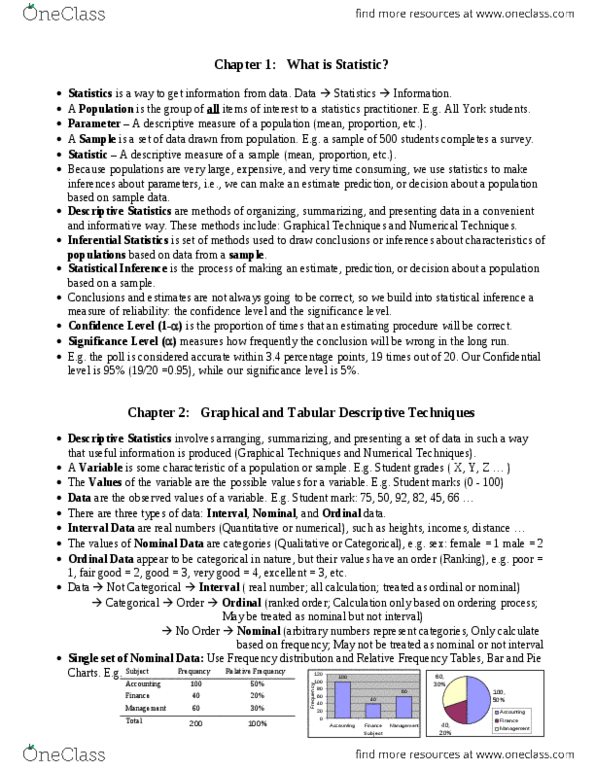
Chapter 2 section 3: graphical and tabular descriptive. Multiple choice: which of the following represents a graphical presentation of interval data, a bar chart, a histogram, a pie chart, all of these choices are true. This may not be resold, copied, or distributed without the prior consent of the publisher: positively skewed, negatively skewed, symmetric, none of these choices. Pts: 1: compare the two histograms below. Ref: section 2. 3: the sum of the relative frequencies for all classes in a histogram always equals the number of classes. the class width. the total of all the frequencies. This may not be resold, copied, or distributed without the prior consent of the publisher: compare the spread of the two histograms below. Its shape resembles a histogram turned on its side. It provides an organized way to depict interval data: you can recreate the original data set from it. b. c, all of these choices are true.