BIO205H5 Lecture 14: BIO205 Lecture 14 (Oct 24, 2012) - EDIT.docx

Document Summary
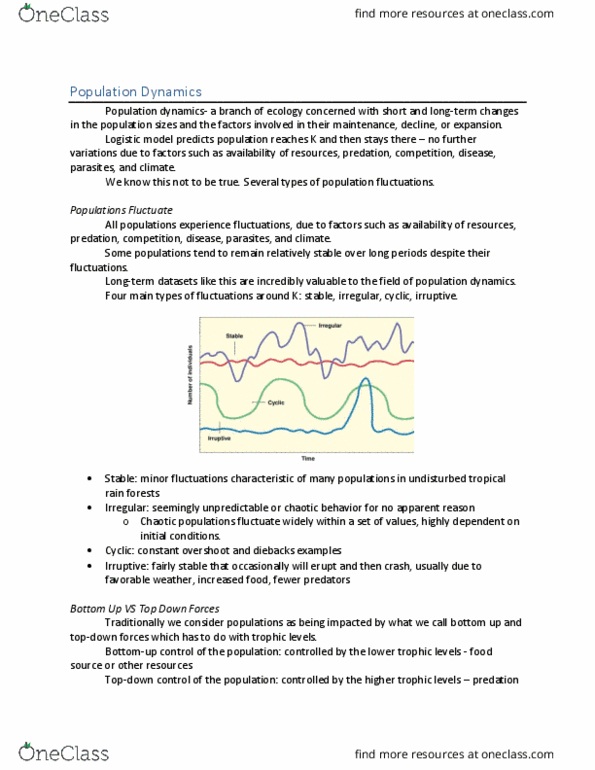
We can draw both isoclines on the same graph. Image removed: those 2 lines can cross at a different direction, orange area: below for pop 2, which directions are the arrows moving. A special type of competition: predation: 4 cheetahs watching a gazelle picture. What happens when the predator population continuously increases: the prey population stops growing and decreases. We can model predator-prey relationships with lotka-volterra models. Image removed: c: efficiency of predation, b: efficiency of food conversion into predator population growth, d: probability of mortality. Predator-prey relationships can be analyzed with the lotka-volterra model: plotting on a single graph, and when plotting on a time graph, there"s a delay of predator increase and then prey. Image removed going down and predator decreasing and then the cycle starts again. Lynx prey preferentially on snowshoe hares graph: you can see the similar pattern where decreasing in prey population and increasing in predator population and then predator decreasing while prey increases, etc;