ADMS 2320 Study Guide - Midterm Guide: Bar Chart, Pie Chart, Sample Space

10 Aug 2013
School
Department
Course
Professor


Document Summary
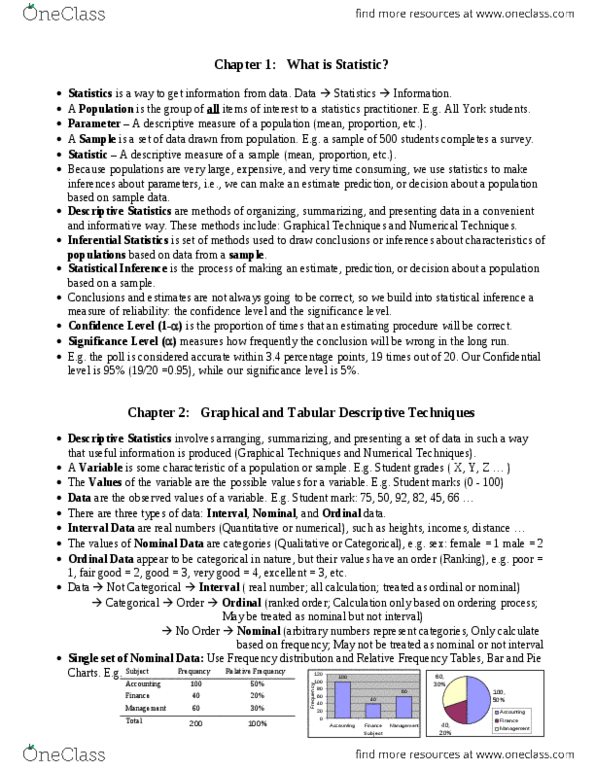
Statistics: a way to get to transfer data into useful information. Population is entire set of obv. descriptive measure is called a parameter. Sample is a subset of population, descriptive measure is called statistics. Variable: a characteristic of population or sample of interest to us. Values of a variable are all possible observations ex. Histograms: all data are interval, with class intervals. Ordinal: categorical in nature but have an order (ranking) ex. Poor=1 fair good=2 good=3 excellent=4 bar chart. Allowed only freq or relative freq= freq/total freq. Pie chart relative frequencies bar chart bin and frequency. Histogram: important graphical method for single set of interval data, it doesn"t only summarize interval data but also explain probabilities. Class width = (largest observation- smallest observation)/ # of classes. Symmetry: two sides are identical in shape and size. Skewness: histogram with a long tail extending to either right or left: modality: unimodal is one single peak, while bimodal is one with two peaks.