PS101 Chapter Notes -Normal Distribution, Sampling Distribution, Percentile

Document Summary
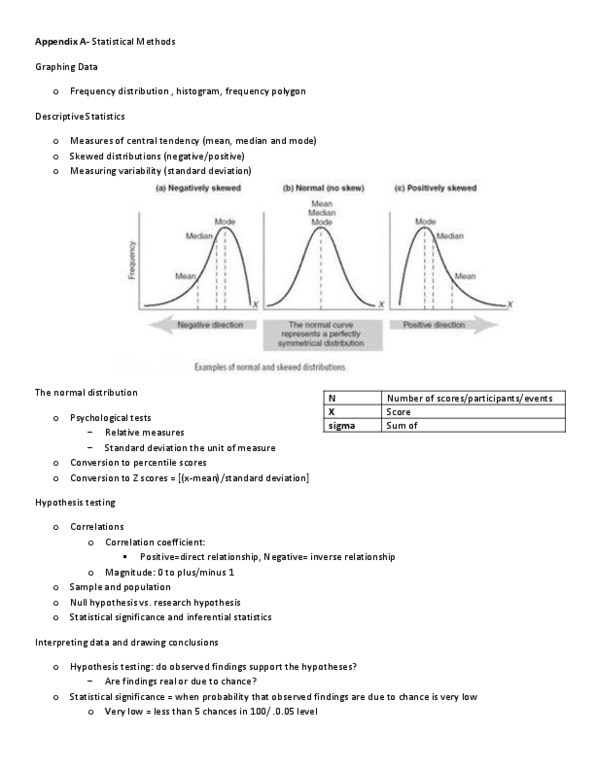
Stats are useful in the study of human behaviour. N=total number of observation or scores in a set. Sigma=greek capital letter sigma, the sum of. Frequency distribution: how often each possible score actually occurred. Grouped frequency distribution: group adjacent scores into equal sized classes or intervals, e. g. range 1-50 (1-5, 6-10, 11-15) Bar graph/histogram: draw rectangles above each score, indicating the number of times it occurred. Frequency polygon/line graph: indicated by dot placed directly over score on horizontal axis, appropriate height on vertical axis. Graphs exaggerate or mask differences, depending on units. Central tendency: characterize an entire set of data in terms of a single number, mean. Sum of scores/number of scores: the median. Sometimes extremely high score can dramatically raise the mean. Median more representative measure when extreme scores occur: mode. Tell whether scores are clustered closely around the mean or widely scattered. Gives on average how much scores differ from the mean.