Statistics 1770 Lecture Notes - Unimodality, Standard Deviation, Interquartile Range

Document Summary
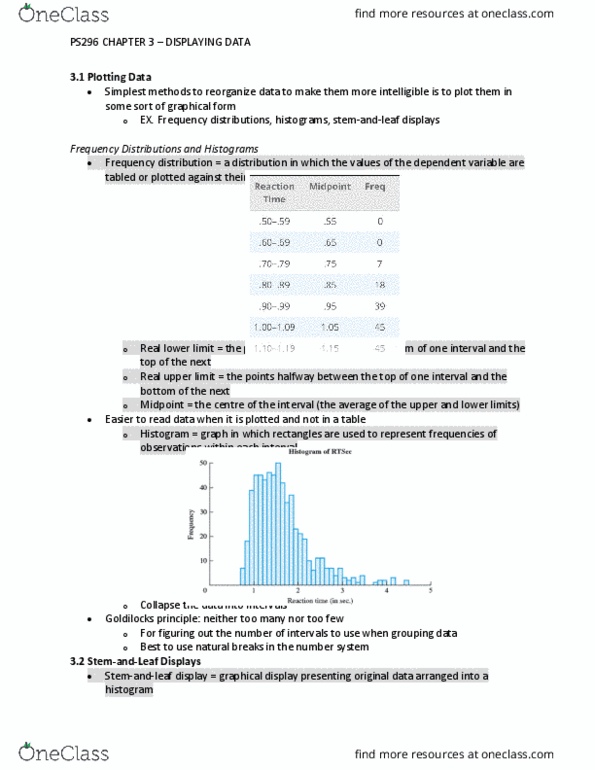
Histogram: essentially just graphical display of the (binned) frequency table, divide the range of data into intervals (bins) Record the number of observations (count, frequency) Or the proportion of the total observations (relative frequency) in each interval. Frequency (or relative frequency), determine the height of the rectangles in the histogram: typical rollercoaster ahs top speed of between 60-70, top speeds range between 40-100 mph. Graph or frequency table describes a distribution. A distribution tells us the possible values of a variable as well as the occurrence of those values (frequency or relative frequency: with quantitative data, we are not usually interested in count/proportion of particular values. Shape: symmetric, skewed left, skewed right.