PSYC 1010 Chapter Notes - Chapter 2: Unimodality, Frequency Distribution

Document Summary
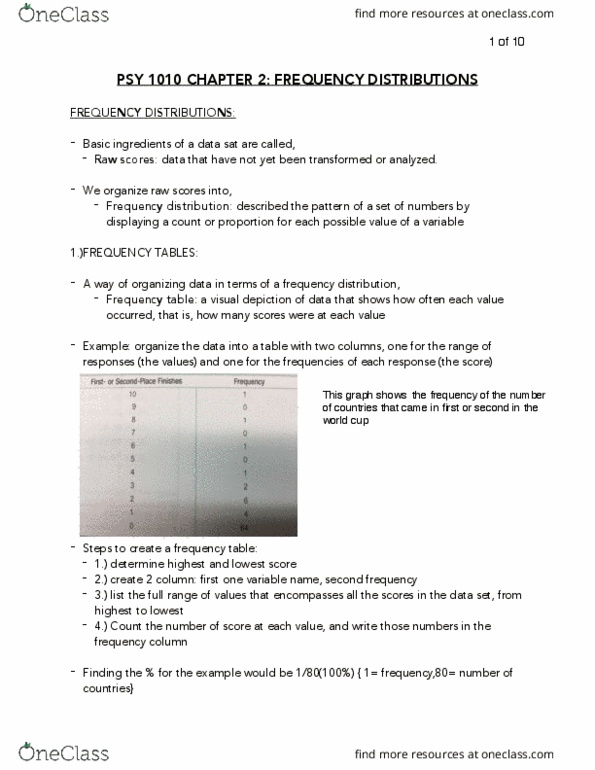
Raw scores- data that have not yet been transformed or analyzed. Frequency distribution- describes the pattern of a set of numbers by displaying a count or proportion for each possible value of a variable. Visual depiction of data that shows how often each value occurred; how many scores were at each value. The best way to create an easy-to-understand distribution of data. The data can then be displayed as a grouped frequency table, a frequency histogram, or a frequency polygon. A frequency table shows the pattern of our data by indicating how many participants had each possible score. The data in a frequency table can be graphed in a frequency histogram or a frequency polygon. Create two columns: first column labeled with the variable name, second column labeled frequency . List the full range of values that encompasses all the scores in the data set- include all values in the range.