ECO220Y1 Chapter Notes - Chapter 5: Box Plot, Quartile, Percentile


27
ECO220Y1 Full Course Notes
Verified Note
27 documents
Document Summary
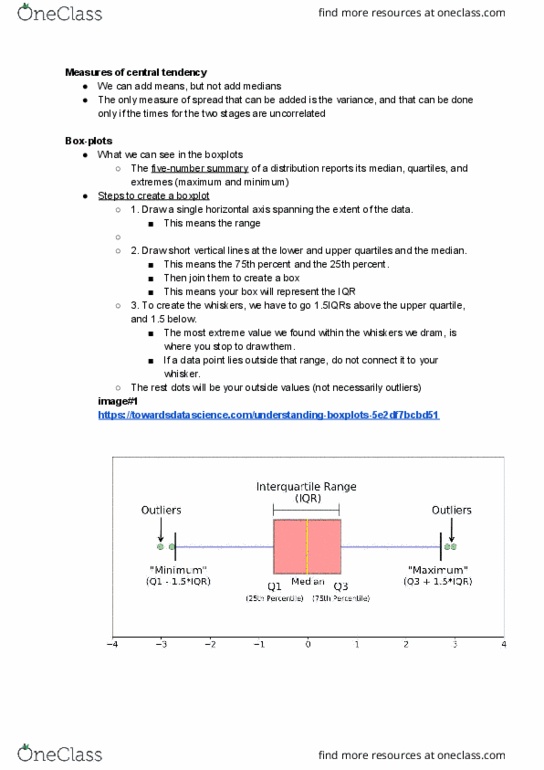
Chapter 5: displaying and describing quantitative data (5. 7 5. 14) The mean can be calculated from grouped data by multiplying midpoints by the % of people who chose that option and adding the results. You can use the midpoints of ranges in the regular formula for variance and also multiply by the % (p) of the sample in that group: Five-number summary of a distribution reports its median, quartiles, and extremes. A five-number summary of a quantitative variable can be displayed in a boxplot: boxplot: a boxplot displays the five-number summary as a central box with whiskers that extend to the non-outlying values. Steps to create a boxplot: draw a single vertical axis spanning the extent of the data, draw short horizontal lines at the lower and upper quartiles and at the median. Q3 + 1. 5*iqr = upper fence: grow whiskers .