QMS 102 Lecture Notes - Lecture 4: Ryerson University, Quartile, Ogive

11 Dec 2013
School
Department
Course
Professor
Document Summary
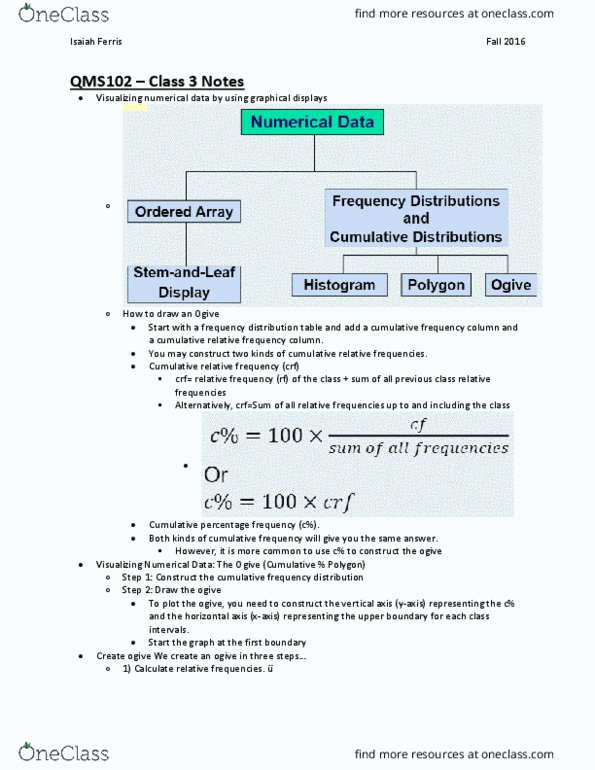
To plot an ogive construct the vertical axis (y-axis) representing the c% and the horizontal axis (x-axis) representing the upper boundary for each class interval. Start the graph at the first boundary. Plot all points (upper boundary, c%) and connect them with line segments. The rules for plotting an ogive apply to any cumulative relative frequency distribution. Even if there are classes of unequal width or open ended classes. To find the percentage less than 80000 go vertically upward at 80 of the x-axis until you hit the ogive. So, 65% of the total 78 products is 65/100 * 78 = 50. 7. 100-84 for annual sales do not need to multiply by 100 as it is already in a percentage. A percentile is the value below which a certain percent of observation fall. The symbol for percentile is p = kth percentile.