CHEM 1E03 Study Guide - Potassium Thiocyanate, Equilibrium Constant, Rice Chart

3 Feb 2014
School
Department
Course
Professor


63
CHEM 1E03 Full Course Notes
Verified Note
63 documents
Document Summary
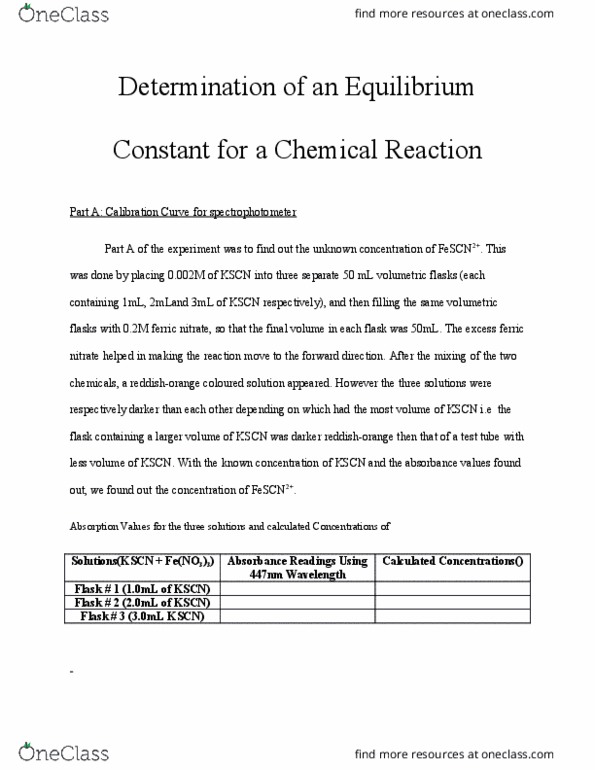
A spectrophotometer will be used to attain an absorbance values for part a and b of this lab. In part a students are to calculate the concentration of fescn2+ions that formed. A graph will also be made from absorbance values and fescn2+concentrations. For the second part of the lab students are given the concentrations of. Kscn and fe(no3)3 and is expected find the unknown equilibrium concentrations of fe3+,scn-, and fescn2+ and the k value for equilibrium of rxn: fe3+ (aq) fescn2+ (aq)+scn- (aq) . Chemistry 1e03 laboratory manual; mcmaster university: hamilton, on, 2013; p 43-47. A=y[conc] (where y" is k & a" is absorbance value) V [kscn]=0. 001l (flask#1) (0. 002mol/ l)(0. 001 l) (0. 05 l) C2=4. 00 10-5mol/l is the concentration of fescn2+ions formed(also the initial concentration of scn- ions) for flask # 1. Graph: (using values from table 1 & 2) For test tube#1 (sample calculation: using: c1v1=c2v2. Convert to mol : using: c1v1=c2v2 (0. 002mol/l)(5ml)= c2(10ml)