BIO 1109 Study Guide - Standard Score, Confidence Interval, Null Hypothesis

10 Feb 2014
School
Department
Course
Professor
Document Summary
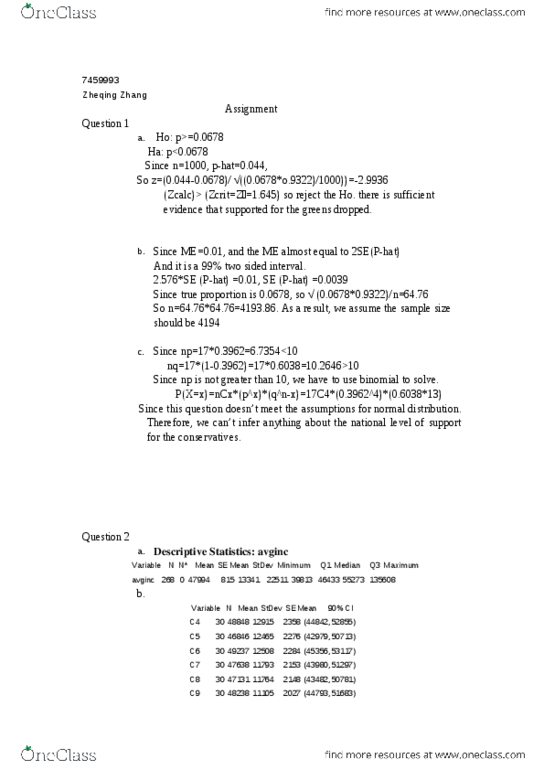
Ho: u = 0. 3961 - 0. 1 = 0. 2962. Zcalc < zcrit therefore there is sufficient evidence to reject the null in favour of the alternative. n= (z /2 / e)^2 (p^)(q^) n=(2. 576 / 0. 01)^2 (0. 262) (0. 738) n=12,830. 67 n=12,831. A sample size of 12,831 would be required given the margin of error of +-1% and a confidence interval of 99%. As the sample is so small this does not allow us to infer anything about the conservative polls. Test of mu = 26 vs < 26. N mean stdev se mean bound t p. Since 0. 086 > 0. 05 we fail to reject the null hypothesis. As shown by the graph it makes sense that we fail to reject the null as that would indicate that it is very likely that the mean value is 26. As a large amount of data lies between 25 and 26 it is quite possible that mean value is in fact 26.