STAT151 Lecture Notes - Probability Plot, Normal Distribution, Standard Deviation

7 Mar 2014
School
Department
Course
Professor


4
STAT151 Full Course Notes
Verified Note
4 documents
Document Summary
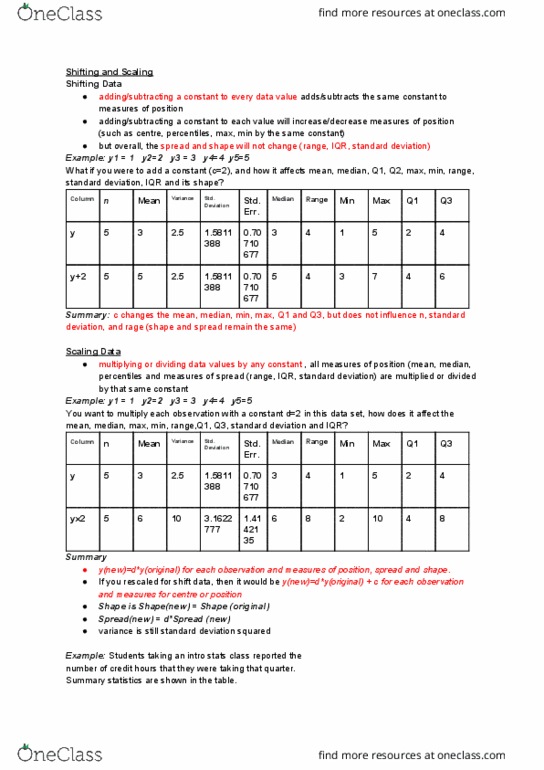
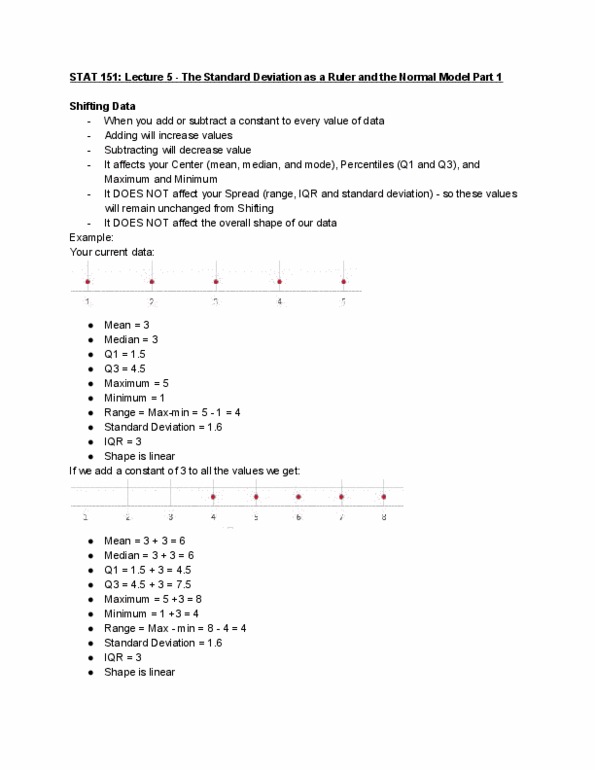
Ch 6 the standard deviation as a ruler and the normal model. Adding (or subtracting) a constant to every data value adds (or subtracts) the same constant to measures of position. Adding (or subtracting) a constant to each value will increase (or decrease) measures of position: center, percentiles, max or min by the same constant. Its shape and spread - range, iqr, standard deviation - remain unchanged. Median range min max q1 q3 y y + 2. If ynew = yoriginal + c for each observation. Example: you have a data set: y1 = 1, y2 = 2, y3 = 3, y4 = 4, y5 : if you want to multiply each observation with a constant d = Median range min max q1 q3 y y * 2. 3 of 21 originalnewydy originalnewcenterdcenter originalnewpositiondposition originalnewspreaddspread originalnewshapeshape thus, if you rescale and shift data: for each observation.