PS296 Chapter Notes - Chapter 3: Mutual Exclusivity, Statistical Parameter, Bayesian Probability


Document Summary
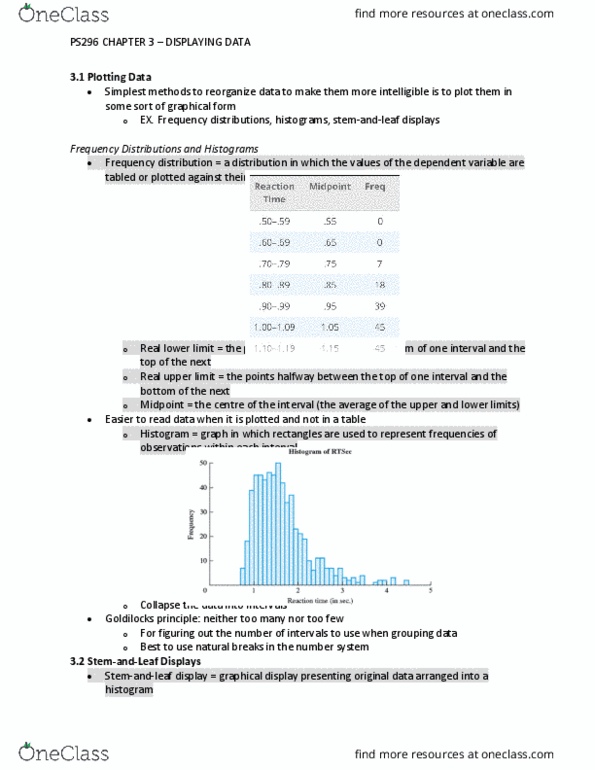
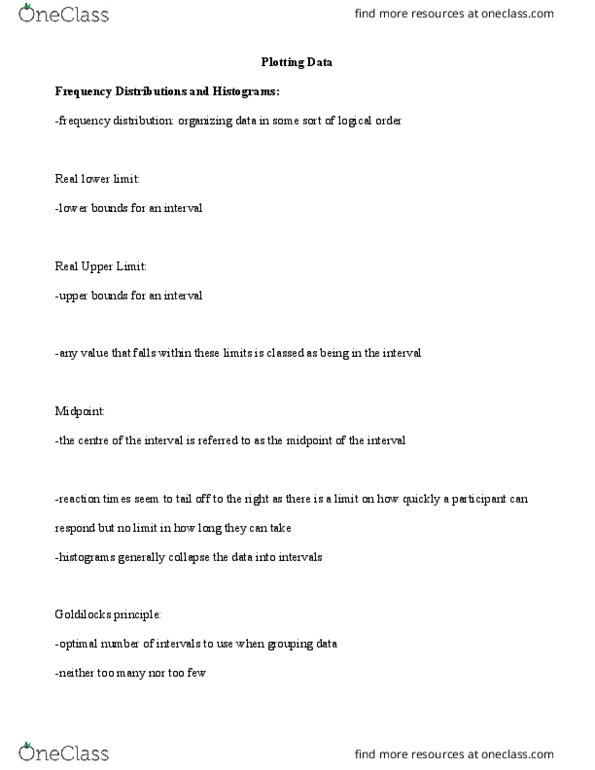
Collection of #"s to be interpretable, must first be organized in some sort of logical order. 3. 1 plotting data simplest way to reorganize data is to plot them in graphical form frequency distributions, histograms, bar graphs, stem-and-leaf displays. Distribution where values of dv are plotted against their frequency of occurrence. Real lower limit point halfway between the bottom of one interval & top of the one below it. Real upper limit point halfway between the top of one interval & the bottom of the one above it. Optimal # of intervals to use when grouping data follows the: Goldilocks principle neither too many nor too few. Bar graph frequency of occurrence of different values of x is represented by the height of the bar. Uses vertical bards to represent whatever is being measured. Line graph y values corresponding to values of x are connected by line.