Economics 2150A/B Lecture Notes - Isocost, Fixed Cost, Mineral Water

19 Apr 2014
School
Department
Course
Professor


9
ECON 2150A/B Full Course Notes
Verified Note
9 documents
Document Summary
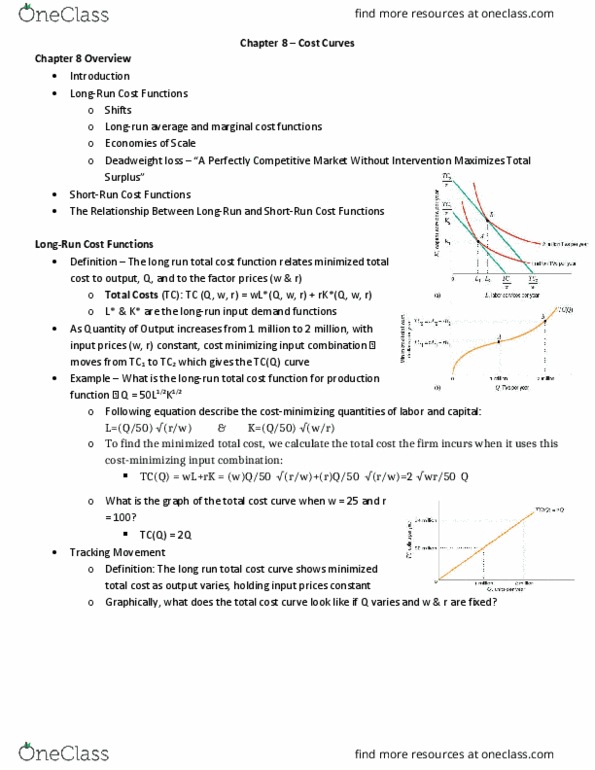
Lrtc shows how tc varies with output q holding input prices fixed and choosing inputs to minimize costs. Plot the lrtc curve from the lr cost minimization problem: lr total cost demoted by tc(q) shows how minimized total cost varies with holding input prices fixed and and selecting inputs to minimize output, cost. L* and k* are the input demand functions, which solve the lr cost minimization problem. Tc = w ( rq w )1 /2 ( wq r )1/2. Tc = 2w r q 1/2. The expression above is the lrtc curve and it tells you how tc vary with w,r, and q, the. One input price changes: q: how does lr cost vary when 1 input price changes? exogenous variables. An increase in the price of an input rotates the tc curve upward. It pivots down to c2 when the price of k rises.