SOC222H5 Chapter Notes - Chapter 2: Frequency Distribution

Document Summary
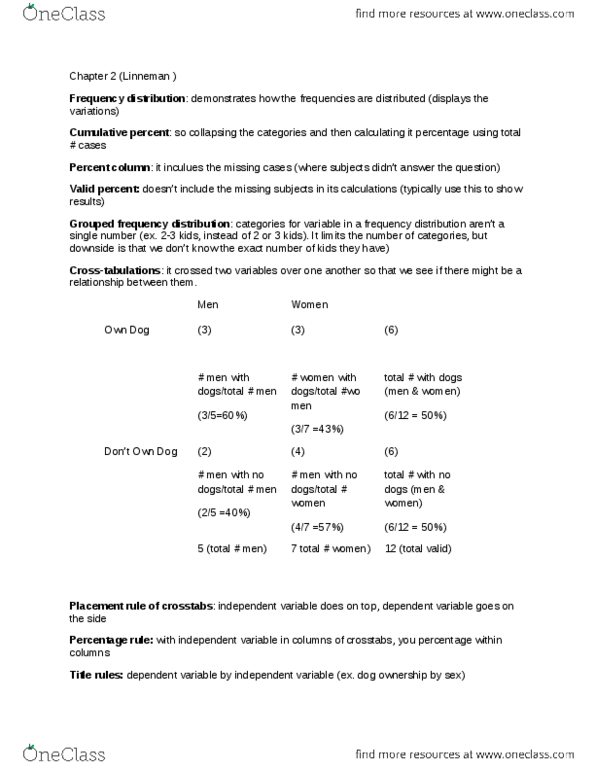
Frequency distribution: demonstrates how the frequencies are distributed (displays the variations) Cumulative percent: so collapsing the categories and then calculating it percentage using total. Percent column: it inculues the missing cases (where subjects didn"t answer the question) Valid percent: doesn"t include the missing subjects in its calculations (typically use this to show results) Grouped frequency distribution: categories for variable in a frequency distribution aren"t a single number (ex. 2-3 kids, instead of 2 or 3 kids). It limits the number of categories, but downside is that we don"t know the exact number of kids they have) Cross-tabulations: it crossed two variables over one another so that we see if there might be a relationship between them. # women with dogs/total #wo men (3/7 =43%) total # with dogs (men & women) (6/12 = 50%) # men with no dogs/total # men (2/5 =40%)