STAT141 Chapter Notes -Confounding, Scatter Plot, Dependent And Independent Variables

19 Nov 2011
School
Department
Course
Professor
Document Summary
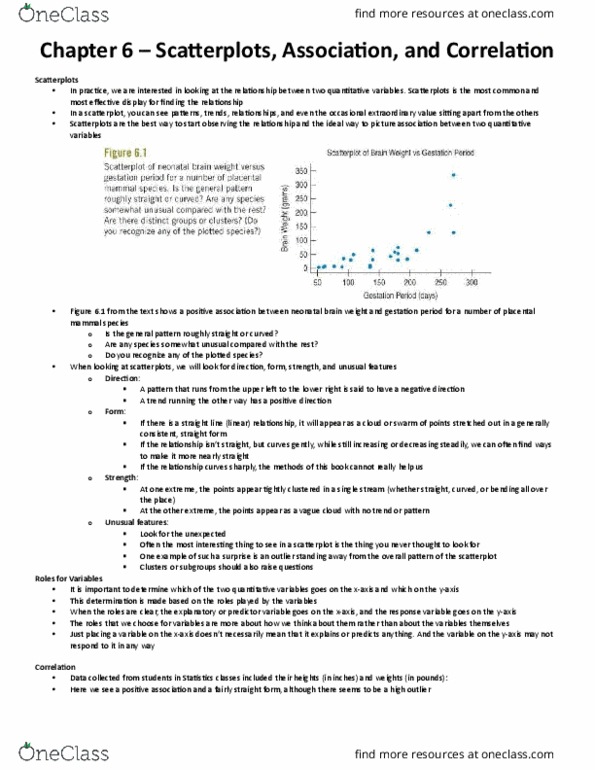
Scatterplots data: scatterplots may be the most common and most effective display for. Just placing a variable on the x-axis doesn"t necessarily mean that it explains or predicts anything. And the variable on the y-axis may not respond to it in any way: when looking at scatterplots, we will look for direction, form, strength, More on scatterplots and unusual features: direction: A pattern that runs from the upper left to the lower right is said. A trend running the other way is said to have positive direction. If there is a straight line (linear) relationship, it will appear as a cloud or swarm of points stretched out in a generally consistent, straight form. If the relationship isn"t straight, but curves gently (exponential growth for example), while still increasing or decreasing steadily, we can often find ways to make it more nearly straight. If the relationship curves sharply however, the methods will not work: strength: