ADMS 2320 Study Guide - Descriptive Statistics, Type I And Type Ii Errors, Qualitative Property

22 Jun 2014
School
Department
Course
Professor

Document Summary
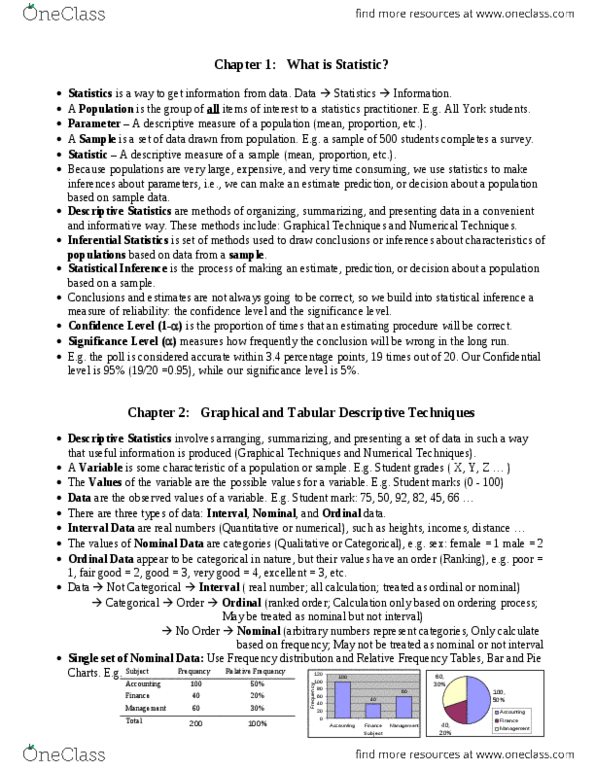
Confidence level: the proportion of times that an estimating procedure will be correct. Descriptive statistics: methods of organizing, summarizing, and presenting data in ways that are useful, attractive, and informative to the reader. Inferential statistics: methods used to draw conclusions about a population based on information provided by a sample of the population. Population: the set of all items of interest. Sample: a set of data drawn from the studied population. Significance level: the relative frequency of a wrong conclusion. Bar chart: chart in which vertical bars represent data in different categories. Bivariate: refers to the distribution of two variables. Pie chart: circle subdivided into sectors representing data in different categories. Qualitative data: non-numerical data (such as a rating a movie fair or good) Quantitative data: numerical data (such as height or income) Variable: any characteristic of a population or sample. Class relative frequency: percentage of data in the class.