Biology 2244A/B Chapter Notes - Chapter 9: Multivariate Normal Distribution, Null Hypothesis, Confounding

7 Dec 2011
School
Department
Course
Professor
Document Summary
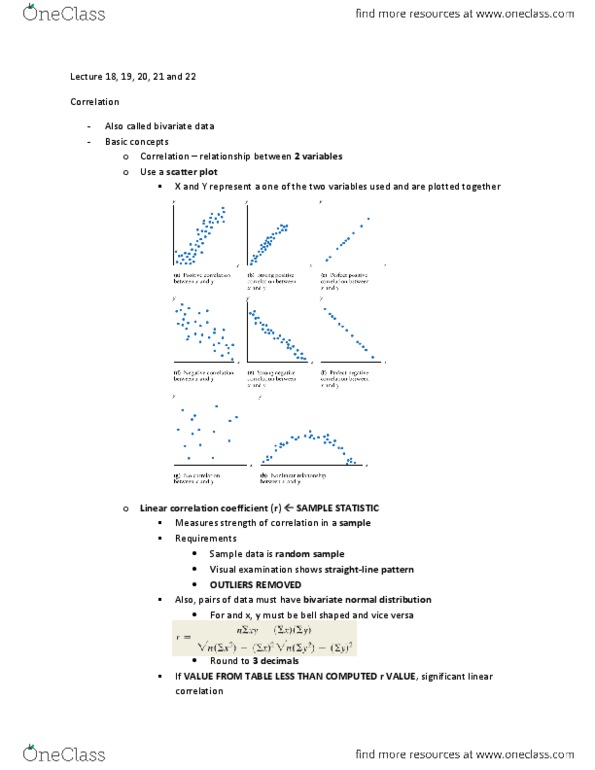
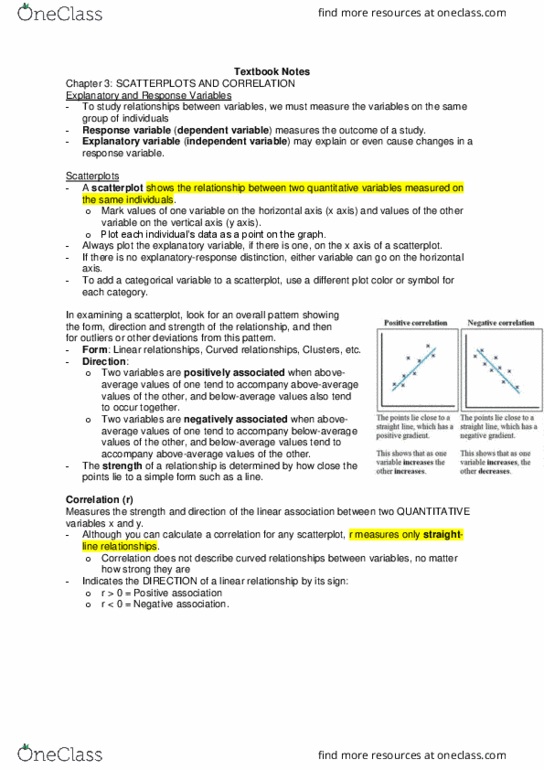
Objective: determine whether association exists btwn 2 variables. Correlation: exists btwn 2 variables when one of them is related to the other in some way. Begin investigation into association btwn 2 variables by constructing scatterplot. Graph in which paired sample data plotted w/horizontal x-axis & vertical y-axis. If exists, want to describe w/equation that can be used for predictions. Each individual pair plotted as a single point. Pattern of points becomes closer to a straight line association btwn x and y becomes stronger. Conclusion largely subjective based on perception of whether a pattern is present. Measures strength of linear association btwn paired x- and y-quantitative values in a sample. Sample statistic used to measure strength of linear correlation btwn x and y. When testing hypotheses or making other inferences about r: sample of paired data is random sample of quantitative data, visual examination points approximate straight-line pattern, outliers must be removed if known to be errors.