Statistical Sciences 1024A/B Chapter 4: Chapter 4.docx

10 Mar 2012
School
Department
Professor

Document Summary
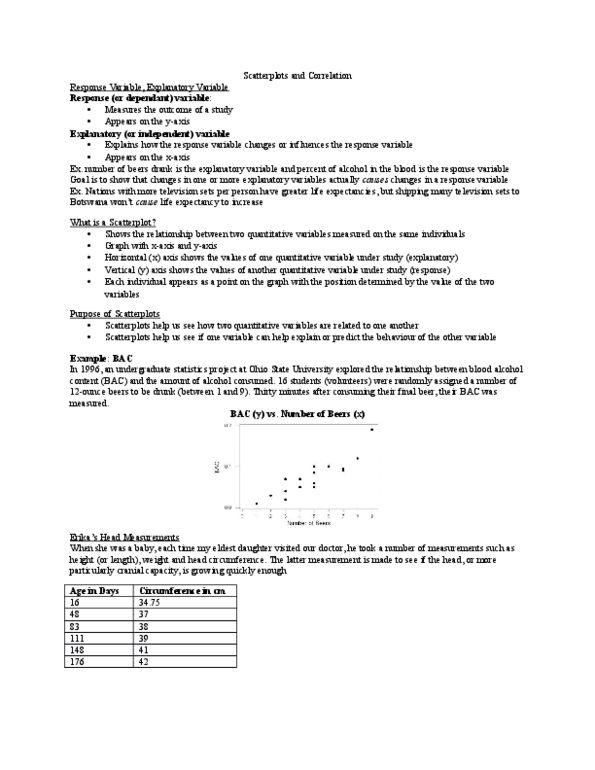
Response(dependent) variable: measures the outcome of the study is on the y-axis. Explanatory(independent) variable: explains how the response variable changes or influences . on the x axis. Strong: the points will tend to fall along a straight line. Weak: will be highly variable about the possible trend line no association if trend line appears to be horizontal. Correlation: measures the direction and strength of the linear relationship between 2 quantitative variables . represented with r, takes on the values between -1 and +1. 1 is perfect linear relationship between the variables. +1 is perfect linear relation between the variables with a positive slope. No unit of measurment doesn"t change when the unit of measurement is changed.