BIOB50H3 Lecture Notes - Lecture 7: Poa Annua, Life Table, Fecundity


Document Summary
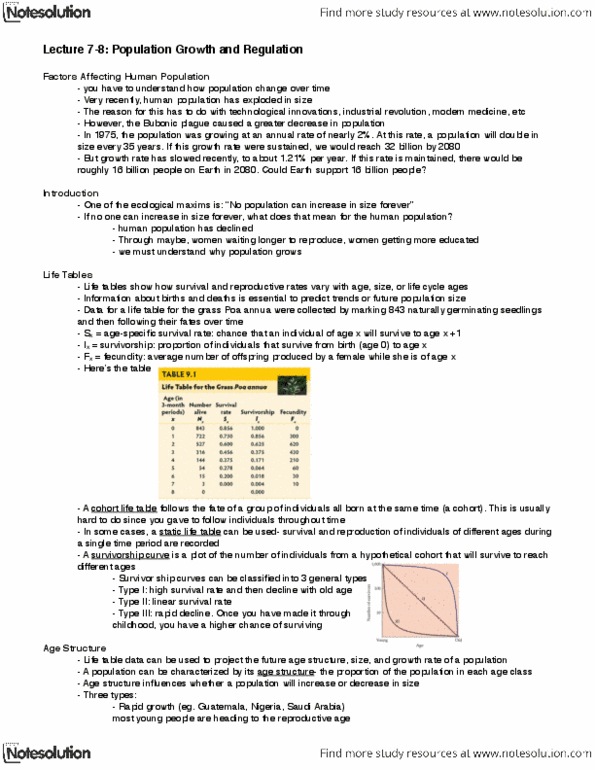
Biob50winter2012 lecture 7 and 8: population growth and regulation (chapter 9 and chapter 10) In 1975 the population was growing at an annual rate of nearly 2% meaning that population would double every 35 years. Life tables: life tables show how survival and reproductive rates vary with age, size, or life cycle stage. Information about births and death is essential to predict trends or future population size. 3 months: sx= age specific survival rate chance that an individual of age x will survive to age x+1. 2: shown in green is the 15-44 age group which is the main reproductive ages, life table data can be used to predict age structure and population size. 3: each of the 24 survivors of age 2 have 4 offspring = 96 newborns, so the new population will have a total of 30 survivors + 108 newborns = 138 individuals.