BIOD60H3 Lecture 9: Lecture 9.docx

18 Oct 2012
School
Department
Course
Professor
Document Summary
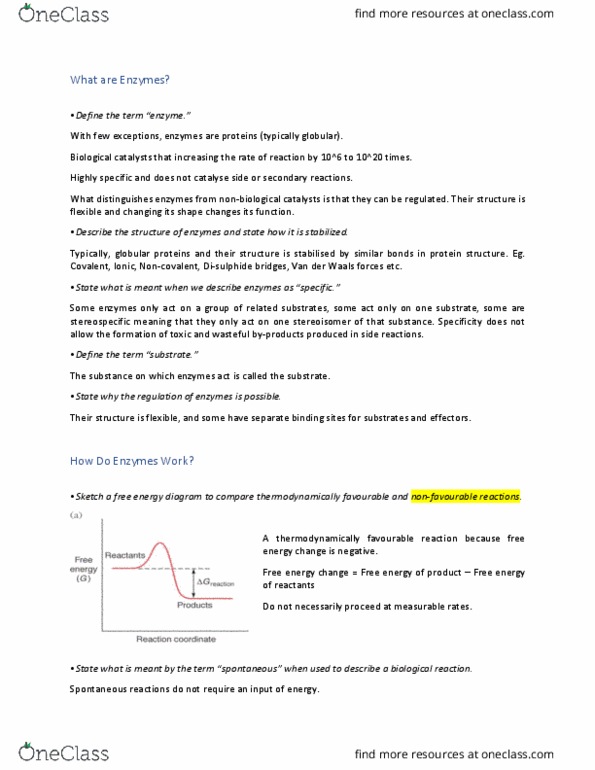
Progress of the reaction: transition state and intermediates during catalysis. The progress of a reaction can be represented by an energy diagram, or energy profile. Figure 6. 1 (slide 2) is an example that shows the conversion of a substrate (reactant) to a product in a single step. The y axis shows the free energies of the reacting species. The x axis, called the reaction coordinate, measures the progress of the reaction, beginning with the substrate on the left and proceeding to the product on the right. This axis is not time but rather the progress of bond breaking and bond formation of a particular molecule. The transition state occurs at the peak of the activation barrier this is the energy level that must be exceeded for the reaction to proceed. The lower the barrier the more stable the transition state and the more often the reaction precede.