STA220H5 Lecture 2: STA220 - LECTURE 2 NOTES.docx

Document Summary
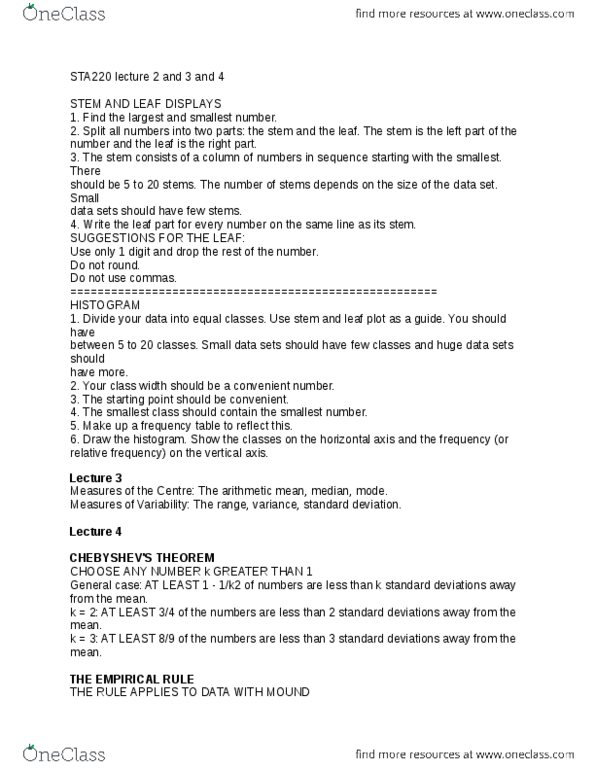
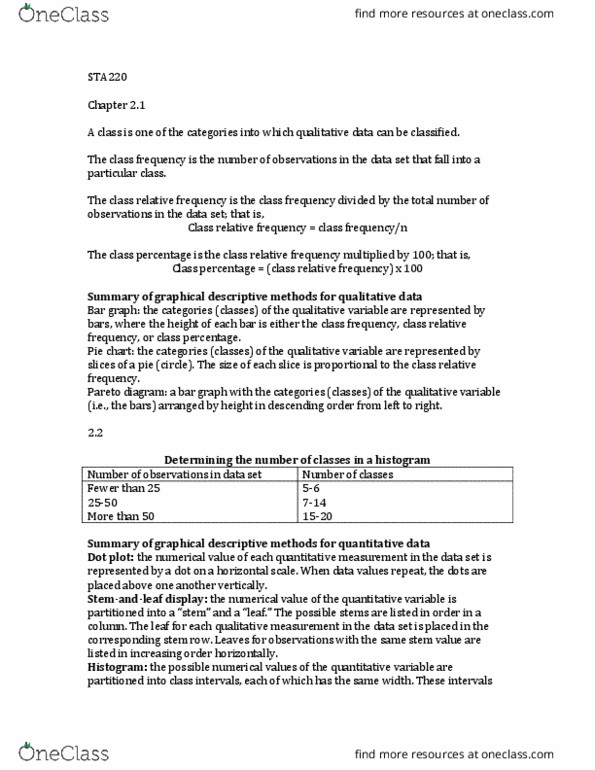
Qualitative variables: graphs - pie charts, bar charts. Quantitative variables: graphs - dotplots, frequency tables, stem and leaf plots, histograms. Stem and leaf plots: find the largest and smallest number, split all numbers into two parts: the stem and the leaf. The stem is the left part of the number and the leaf is the right part: the stem consists of a column of numbers in sequence starting with the smallest. The number of stems depends on the size of the data set. Small data sets should have few stems: write the leaf part for every number on the same line as its stem. Use only 1 digit and drop the rest of the number. Histogram: divide your data into equal classes. Use stem and leaf plot as a guide. You should have between 5 to 20 classes. Show the classes on the horizontal axis and the frequency (or relative frequency) on the vertical axis.