STAT1008 Study Guide - Final Guide: Sampling Distribution, Confidence Interval, Interval Estimation


Sampling Distributions
• Statistic – a number that is computed from data in a sample.
• Parameter – a number that describes some aspect of a population.
• Point estimate - we use the statistic from a sample as a point estimate for a population
parameter.
• Sampling distribution – the distribution of sample statistics computed for different samples of
the same size from the same population.
• It shows us how the sample statistic varies from sample to sample.
• Centre - if samples are randomly selected, the sampling distribution will be centred around the
population parameter.
• Shape - if the sample size is large enough, the sampling distribution will often be symmetric
and bell-shaped.
Sampling Caution
• If sampling bias exists, your sampling distribution may give incorrect information about the
true population parameter.
The Standard Error
• The standard error of a statistic, denoted SE, is the standard deviation of a sample statistic.
• It measures how much the statistic varies from sample to sample.
• It can be calculated as the standard deviation of the sampling distribution.
• A low standard error means statistics vary little from sample to sample, so we can be more
certain that our sample statistic is a reasonable point estimate.
Sample Size
• As the sample size increases, the variability of sample statistics tends to decrease and sample
statistics tend to be closer to the true value of the population parameter.
• As the sample size increases, the standard error decreases, so the sample statistic generally
becomes a better estimate of the population parameter.
3.2 Understanding and Interpreting Confidence Intervals
• Interval estimate - gives a range of plausible values for a population parameter.
• One common form of an interval estimate is point estimate +/- margin of error where the
margin of error reflects the precision of the sample statistic as a point estimate for the
parameter.
• We can use the spread of the sampling distribution (the standard error) to determine the
margin of error for a statistic.
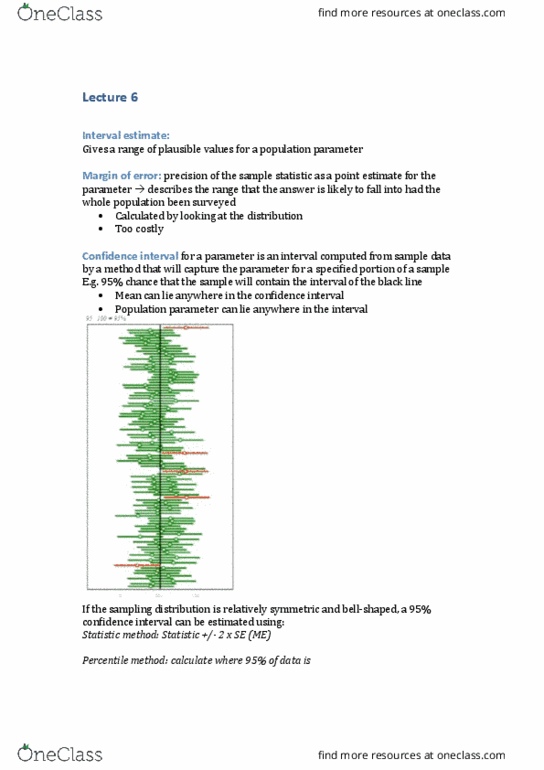
Confidence Intervals
• A confidence interval for a parameter is an interval computed from sample data by a
method that will capture the parameter for a specified proportion of all samples.
• If we can estimate the standard error SE and if the sampling distribution is relatively
symmetrical and bell-shaped, a 95% confidence interval can be estimated using - Statistic
+/- 2. SE
Interpreting Confidence Intervals
• Confidence level - the success rate (proportion of all samples whose interval contain the
parameter).
• For example, we interpret a 95% confidence interval by saying that we are 95% sure that the
interval contains the population parameter.
find more resources at oneclass.com
find more resources at oneclass.com
Document Summary
Sampling distribution the distribution of sample statistics computed for different samples of the same size from the same population. It shows us how the sample statistic varies from sample to sample: centre - if samples are randomly selected, the sampling distribution will be centred around the population parameter. Shape - if the sample size is large enough, the sampling distribution will often be symmetric and bell-shaped. If sampling bias exists, your sampling distribution may give incorrect information about the true population parameter. The standard error: the standard error of a statistic, denoted se, is the standard deviation of a sample statistic, a low standard error means statistics vary little from sample to sample, so we can be more. It measures how much the statistic varies from sample to sample. It can be calculated as the standard deviation of the sampling distribution. certain that our sample statistic is a reasonable point estimate.