STAT1008 Study Guide - Final Guide: Dependent And Independent Variables, Test Statistic, Confounding


Multiple Regression
• Response variable: Y (quantitative)
• k predictors: X1, X2, … Xk (quantitative or 0/1 categories)
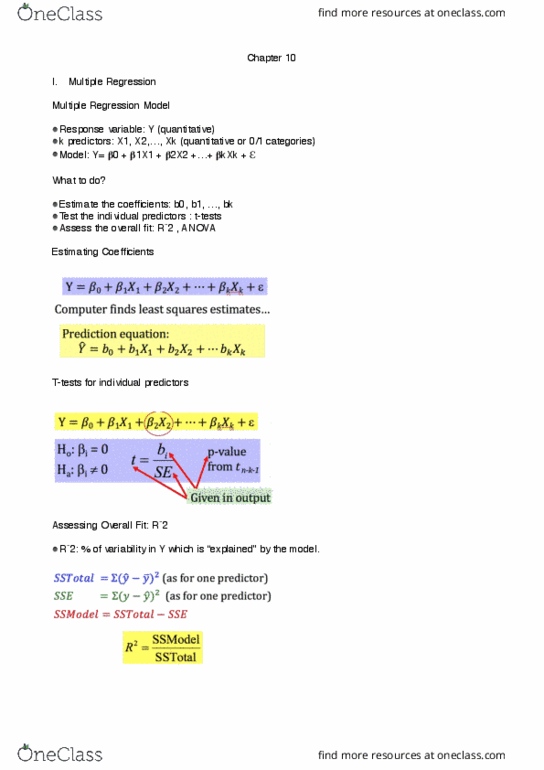
• Model: Y = β0 +β1X1 +β2X2 +···+βkXk +ε
• ε ~ N0,σε) and independent.
What to do?
• Estimate the coefficients: b0, b1,…, k (estimate the same way as a simple model).
• Test the individual predictors: t-tests (use ŷ?.
• Assess the overall fit: R2, ANOVA.
T-tests for Individual Predictors:
• Y = β0 +β1X1 +β2X2 +···+βkXk +ε
• Testing whether X2 be included in the model or not, eg: should exam 2 be in the model
given the presence of exam 1.
• i.e. Testing the effectiveness of any predictor, say Xi, in a multiple regression model.
• H0: βi = 0 vs Ha: βi 0
• Test statistic: t = bi/Sebi
• We find a p-value using a t-distribution with n - k - 1 df, where k is the number of
predictors.
• If we reject the null we see that the predictor is an effective contributor to this model.
• Individual t-tests assess the importance of a predictor after the other predictors are
already in the model, eg: if I add another predictor into the model, exam 1 may
eoe isigifiat.
Assessing Overall Fit: R2
• R2 = % of ariailit i Y hih is eplaied the odel.
• SSTotal = (as for one predictor)
• SSE = (as for one predictor)
• SSModel = SSTotal – SSE
• R2 = SSModel/SSTotal
• Adjusted R2 – usually lower as it contains an additional value.
• R2 is interpreted as the percent of variability in the response values in the sample that
is explained by the fitted regression model.
• Eg: If R2 =0.525, this means that 52.5% of the variability in Final exam scores is
explained by the model based on exam 1 and exam 2.
Assessing Overall Fit: ANOVA
• To test for the overall effectiveness of a regression model: Y = β0 + β1X1 +β2X2 +···+βkXk
+ε
• H0: βi = β2 =…= βk = 0 (the model is ineffective)
• Ha: At least oe βi 0 (at least one predictor in the model is effective)
• Mean square = SS/df
10.2 Checking Regression Conditions
Conditions for a Regression Model:
find more resources at oneclass.com
find more resources at oneclass.com
Document Summary
Multiple regression: response variable: y (quantitative, k predictors: x1, x2, xk (quantitative or 0/1 categories, model: y = 0 + 1x1 + 2x2 + + kxk + , ~ n(cid:894)0, ) and independent. What to do: estimate the coefficients: b0, b1, , (cid:271)k (estimate the same way as a simple model), test the individual predictors: t-tests (use ? (cid:895), assess the overall fit: r2, anova. If we reject the null we see that the predictor is an effective contributor to this model. Individual t-tests assess the importance of a predictor after the other predictors are already in the model, eg: if i add another predictor into the model, exam 1 may (cid:271)e(cid:272)o(cid:373)e (cid:862)i(cid:374)sig(cid:374)ifi(cid:272)a(cid:374)t(cid:863). Histogram/dotplot of residuals: check normality reasonable symmetry. In practice, we may not find a single model that is best for all of these criteria and we need to use some judgement to balance between them.