PSY1022 Final: Descriptive statistics

7 Nov 2018
School
Department
Course
Professor
Document Summary
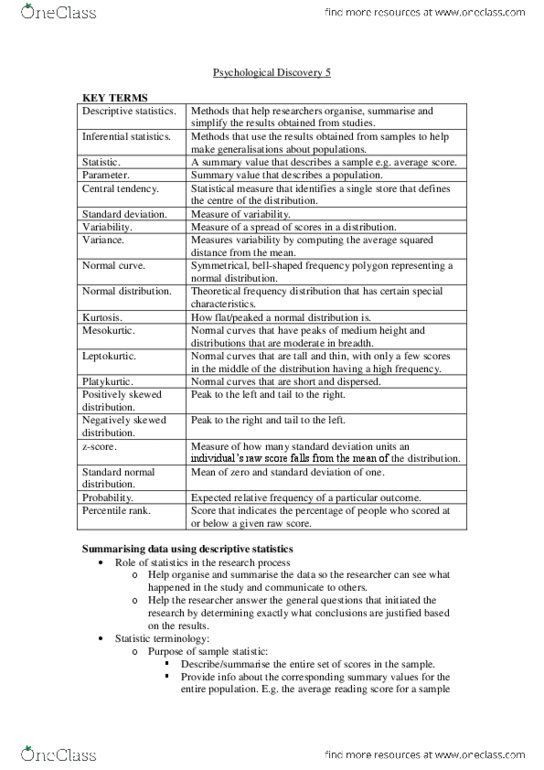
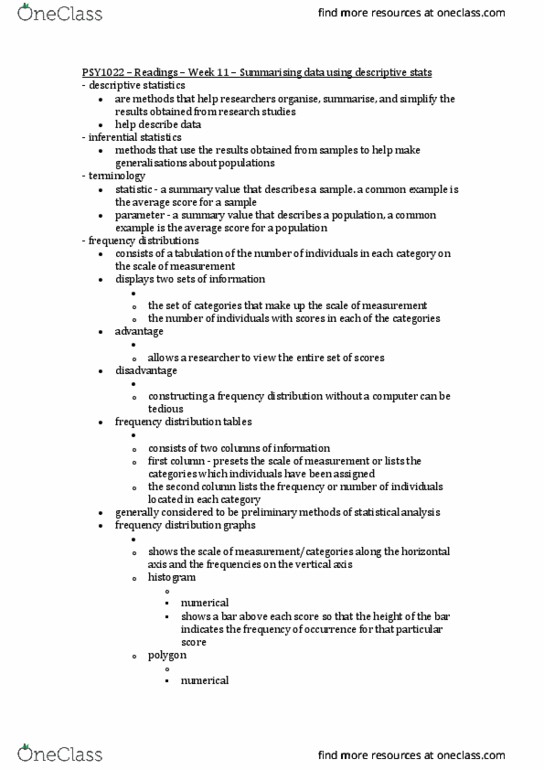
Statistic: a summary value that describes a sample. Parameter: a summary value that describes a population. Most commonly used measure of central tendency. Calculated by dividing the sum of individual scores by the number of scores. Score that divides a distribution in half. More robust statistic than the mean; not affected by outliers. Score or category with the greatest frequency. Highest peak in a frequency distribution graph. Often used when the data is not numerical. Calculate the distance of each score from the mean. Sum of squared deviations is divided by n-1, where n is the number of scores. The n-1 value is called the degrees of freedom. Describes the variation of scores from the mean. Approx 68% of data falls within 1sd from the mean. Approx 95% of data falls within 2sds from the mean. Approx 99. 7% of data falls within 3sds from the mean. Normal curve: a symmetrical, bell-shaped frequency polygon.