ECON1101 Study Guide - Quiz Guide: Opportunity Cost, Microeconomics, Equilibrium Point


PRAC QU for quiz 1
USE A DIAGRAM TO EXPLAIN !!
Question 1. What is the production possibilities curve? Explain its shape. Under what
circumstances might the PPF be a straight line?
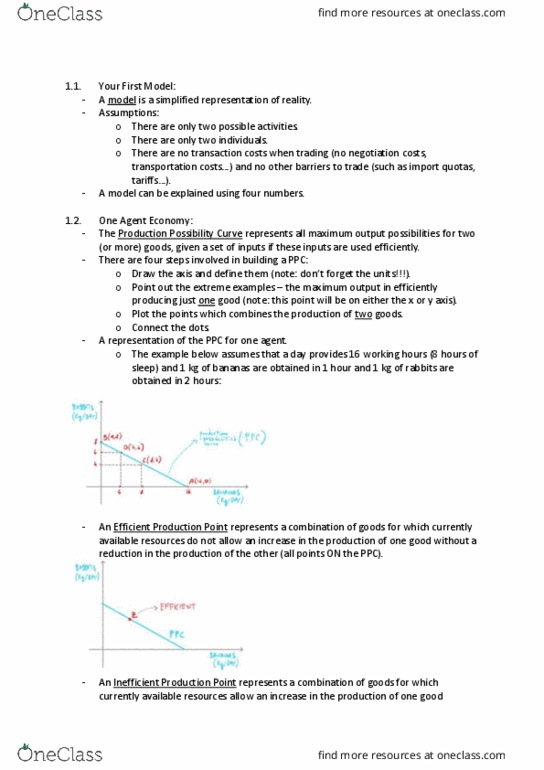
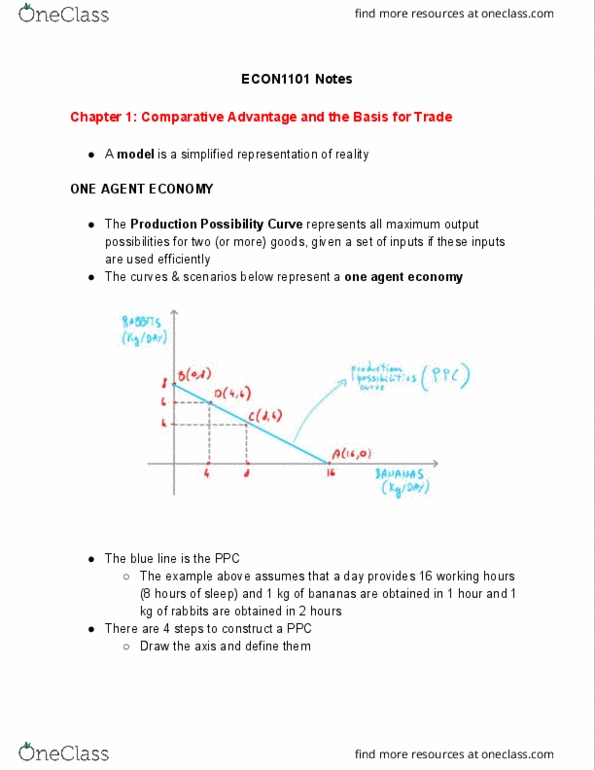
The production possibility frontier is a graphical representation of all the possible
combinations of the production of two goods or services (or two types of goods or services)
that a hypothetical economy can produce at any given time. It demonstrates how
opportunity costs arise when individuals or the community makes choices.
The production possibility frontier shows the maximum output for an economy for a given
point in time. All points on the frontier itself represent points at which the economy is
operating at full capacity – that is, all resources are fully employed. If the economy were
producing inside the curve, it would be inefficient – producing less than its maximum
possible output and resources would not be fully employed.
Question 2. How does the production possibility frontier reflect the principle of
increasing opportunity costs?
The production possibility frontier is a graphical representation of all the possible
combinations of the production of two goods or services (or two types of goods or services)
that an economy can produce at any given time. It demonstrates how opportunity costs
arise when individuals or the community makes choices.
In the real economy, the production possibility frontier is drawn concave into the origin.
This is because some resources are better suited to the production of one good than the
other. Resources cannot move from food production to clothing without any loss of
productive capacity, and vice versa. When additional resources are allocated into the
production of one good, they will become less productive, increasing the opportunity cost of
another good.
In a production possibility frontier, the opportunity cost of one good relative to another is
represented by the gradient of the curve. Taking cows and guns as an example, cows are
graphed along the y axis and guns are graphed along the x axis. At a particular point, the
opportunity cost of producing guns is represented by the amount of cows given up to
produce additional guns. Thus, the opportunity cost is given by the change of the amount of
cows given up, divided by the change of the amount of guns produced. This is the gradient
of curve at a particular point, represented by the rise over the run of the tangent.
find more resources at oneclass.com
find more resources at oneclass.com
Document Summary
The production possibility frontier shows the maximum output for an economy for a given point in time. All points on the frontier itself represent points at which the economy is operating at full capacity that is, all resources are fully employed. If the economy were producing inside the curve, it would be inefficient producing less than its maximum possible output and resources would not be fully employed. The production possibility frontier is a graphical representation of all the possible combinations of the production of two goods or services (or two types of goods or services) that an economy can produce at any given time. In the real economy, the production possibility frontier is drawn concave into the origin. This is because some resources are better suited to the production of one good than the other. Resources cannot move from food production to clothing without any loss of productive capacity, and vice versa.