26134 Study Guide - Final Guide: Squared Deviations From The Mean, Contingency Table, Interquartile Range

Document Summary
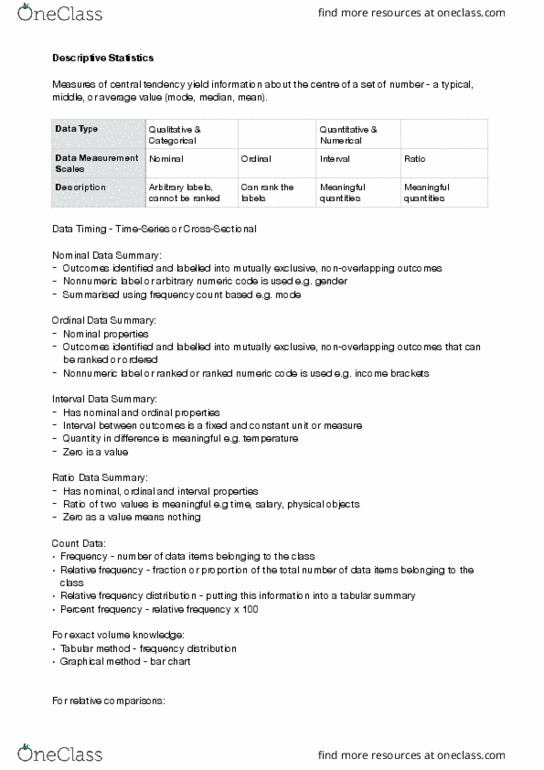
Longitudinal several data collections (various time points, etc: cross sectional one time collections. Qualitative data can be displayed using: frequencies, charts. Lecture 2 describing data (numerical and graphical methods) Measures of central tendency yield information about the center of a set of numbers e. g. a typical, middle or average value. Outcomes identifiable and labeled into mutually exclusive, non-overlapping outcomes. Non-numeric label or arbitrary numeric code is used. Outcomes identified and labeled into mutually exclusive, non-overlapping outcomes that can be ranked or ordered. Non-numeric label or ranked numeric code is used. Example: income brackets; grading brackets (e. g. hd, d, c) A useful function for frequency counting of arbitrary numerical labels is countif. Values can then be used in bar graphs or pie graphs. Frequency: number of data items belonging to the class. Relative frequency: fraction or proportion of the total number of data items belonging to the class. Relative frequency distribution: putting this information into a tabular summary.