BIOLOGY 1A03- Final Exam Guide - Comprehensive Notes for the exam ( 190 pages long!)

30 Nov 2017
School
Department
Course
Professor


9
BIOLOGY 1A03 Full Course Notes
Verified Note
9 documents
Document Summary
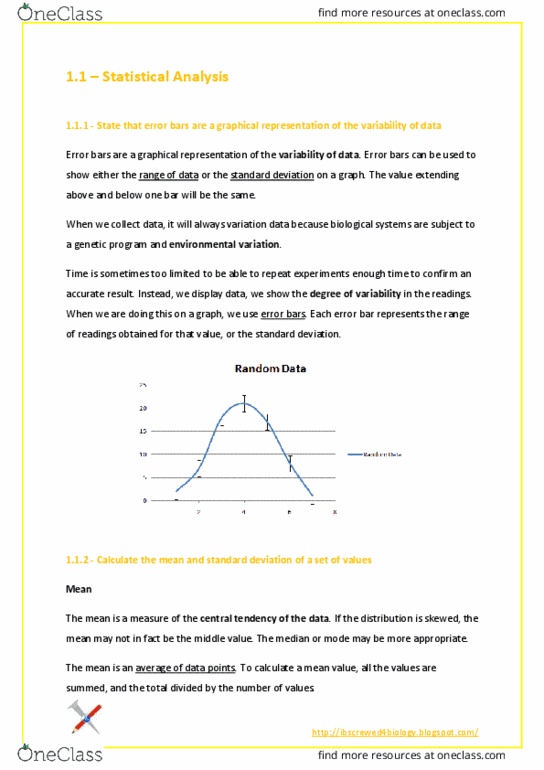
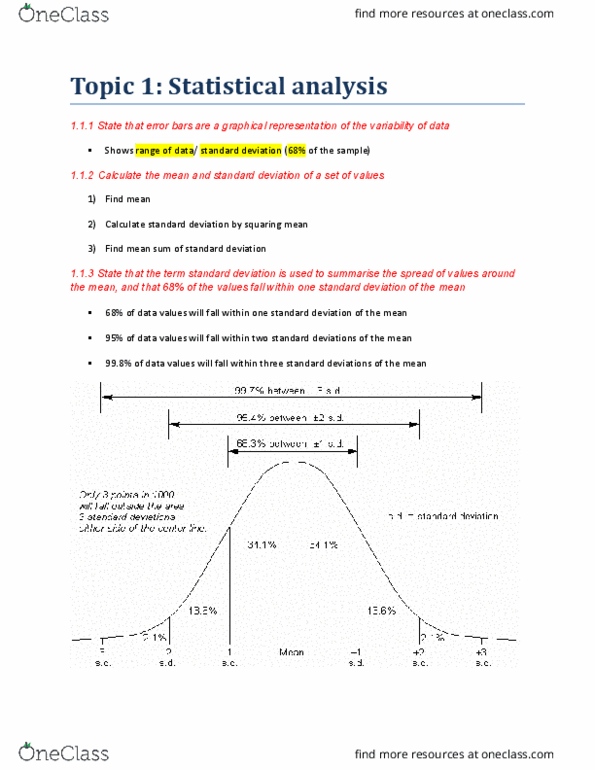
1. 1. 1 - state that error bars are a graphical representation of the variability of data. Error bars are a graphical representation of the variability of data. Error bars can be used to show either the range of data or the standard deviation on a graph. The value extending above and below one bar will be the same. When we collect data, it will always variation data because biological systems are subject to a genetic program and environmental variation. Time is sometimes too limited to be able to repeat experiments enough time to confirm an accurate result. Instead, we display data, we show the degree of variability in the readings. When we are doing this on a graph, we use error bars. Each error bar represents the range of readings obtained for that value, or the standard deviation. 1. 1. 2 - calculate the mean and standard deviation of a set of values.