COMMERCE 2QA3 Study Guide - Final Guide: Unimodality, Scatter Plot

28 Jun 2018
School
Department
Course
Professor
Interpret Patterns in Regression Residuals
Extrapolation and Prediction
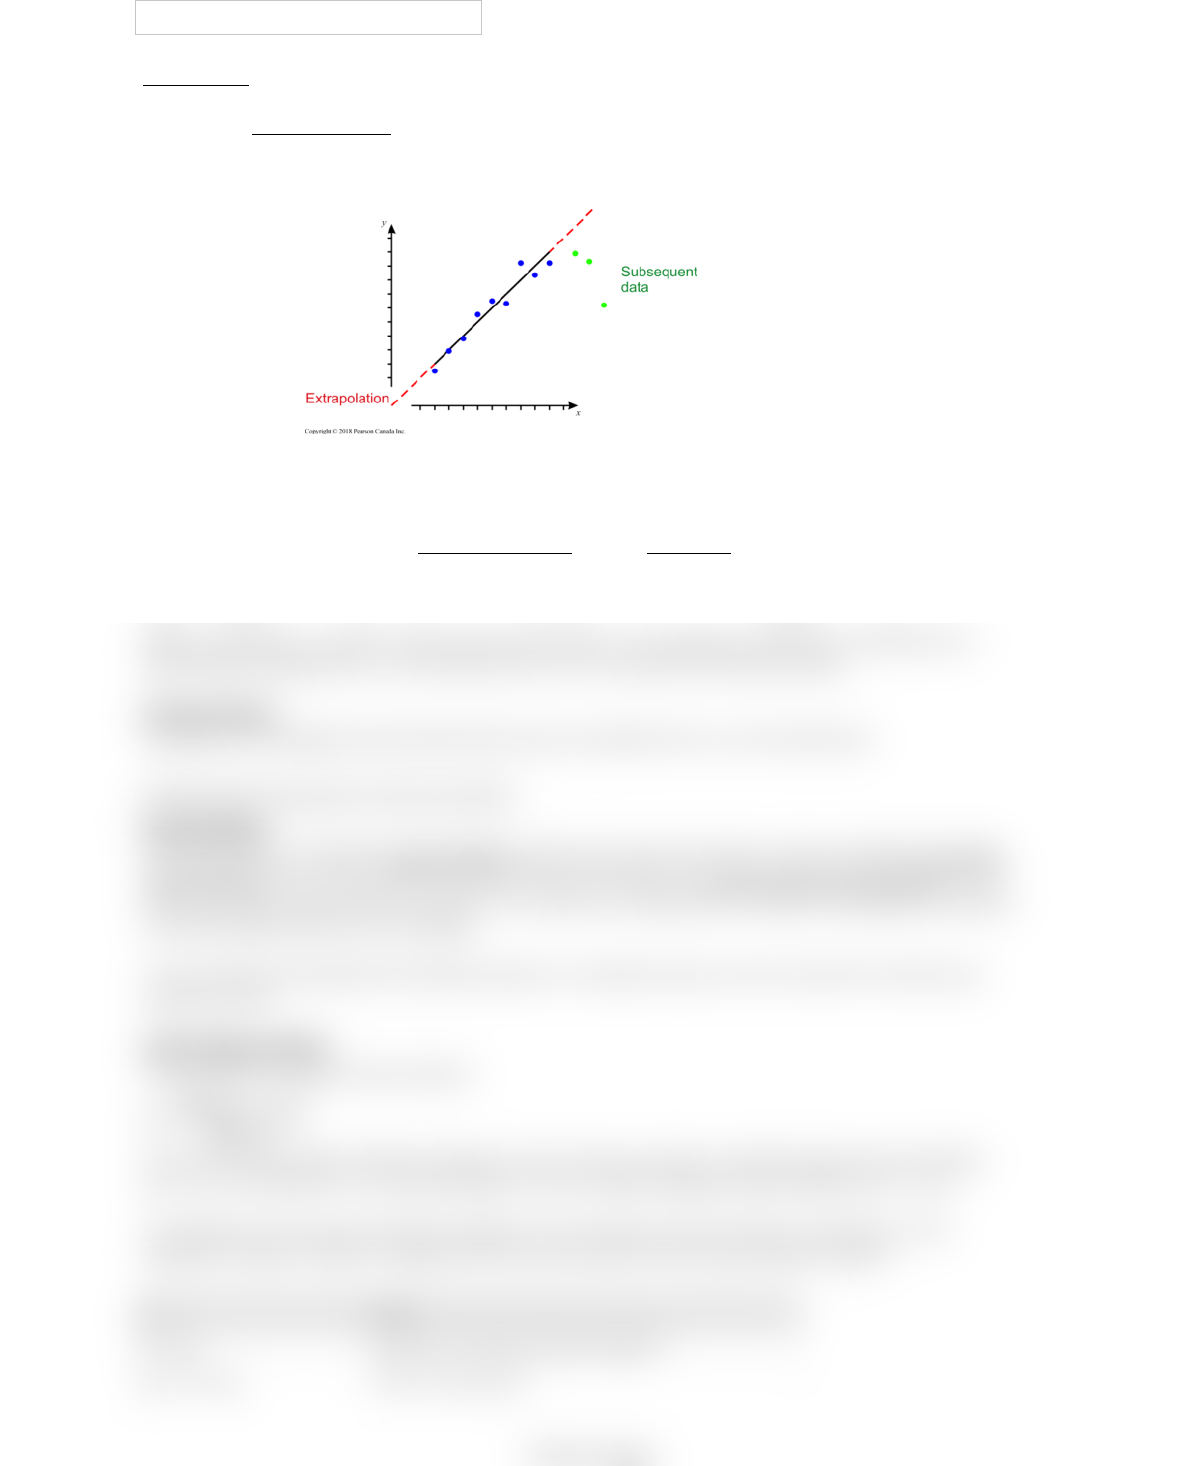
Extrapolating is predicting a y-value by extending the regression model to regions outside the range of the x-
values. It introduces the questionable and untested assumption that the relationship between x and y does
not change in subsequent data.
Therefore, linear models should not be trusted beyond the span of the x-values of the data, because if you
extrapolate too far into the future, actual values will likely be quite far from predicted values.
Unusual and Extraordinary Observations
Large residual
•
Large distance from
, or a high leverage point, which is influential because the omission of a high
leverage point leads to a very different slope
•
In regression, and outlier can stand out in two ways in that it can have a:
High leverage points are important, because they may indicate that the underlying relationship is nonlinear.
Report two models: one with, and one without the outlier. Use scatterplots rather than residual plots to
identify high leverage points, as influential points do not necessarily have high residuals.
Summary Values
Scatterplots of averaged (summarized) data show less variability than un-summarized data.
Understand the Importance of Autocorrelation
Autocorrelation
Time-series data is sometimes autocorrelated, where points near each other in time are related. First order
autocorrelation occurs when adjacent measurements are related, and second order autocorrelation occurs
when every other measurement is related. This violates the independence condition and regression analyses
of autocorrelated data can be misleading.
It can sometimes be detected by plotting residuals vs. predicted values, but this shouldn't be relied upon.
Instead, use the -
Durbin-Watson Statistic
This estimates first-order autocorrelation.
The value of D will always between between 0 and 4 inclusive, where 0 is perfect positive autocorrelation
( for all points), 2 is no autocorrelation, and 4 is perfect negative autocorrelation ( .
The significance of the autocorrelation depends on the sample size and numbers of predictors in the
regression model . Table D in Appendix B lists critical values for the Durban-Watson statistic.
If
Then
Evidence of positive autocorrelation
Test is inconclusive
Understanding Regression Residuals
November 6, 2017
5:03 PM
Statistics Page 1
Document Summary
Extrapolating is predicting a y-value by extending the regression model to regions outside the range of the x- values. It introduces the questionable and untested assumption that the relationship between x and y does not change in subsequent data. Therefore, linear models should not be trusted beyond the span of the x-values of the data, because if you extrapolate too far into the future, actual values will likely be quite far from predicted values. In regression, and outlier can stand out in two ways in that it can have a: Large distance from , or a high leverage point, which is influential because the omission of a high leverage point leads to a very different slope. High leverage points are important, because they may indicate that the underlying relationship is nonlinear. Report two models: one with, and one without the outlier.