GEOG 1050 Study Guide - Final Guide: Ecological Footprint, Occupy Movement, Relate

20 Apr 2017
School
Department
Course
Professor

Document Summary
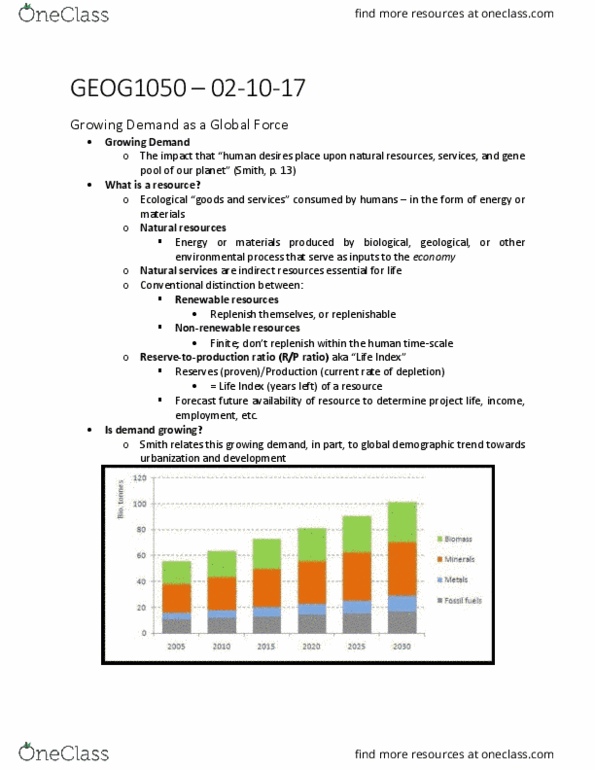
Interpret a basic measure of inequality (gini index: what is inequality, why do you keep talking about percentages, because we can use them to quantify inequality in a population. Meet the gini coefficient: the gini coefficient, steps, collect income data for a given population, sort data from poorest to richest, divide into 10 equal segments. In a perfectly equal society, the poorest 10% (share of the population) owns 10% of the wealth, poorest 20% owns. 20% of the wealth, and so on: best represented graphically, plot the line of perfect equality. Ice ages may not be possible until carbon is re-sequestered (millions of years: climate change, significant and persistent change in the mean state of the climate and its. These gases help keep ea(cid:396)th(cid:859)s surface warmer than would otherwise be the case so more co2, higher te(cid:373)pe(cid:396)atu(cid:396)es : co2 partially closes the atmospheric window (keeps earth warm, an old idea! Arrhenius (1880s) recognizing industry was emitting co2, predicted.