ENH 440 Study Guide - Final Guide: Pairwise Comparison, Confidence Interval, Standard Deviation

20 Dec 2017
School
Department
Course
Professor
Document Summary
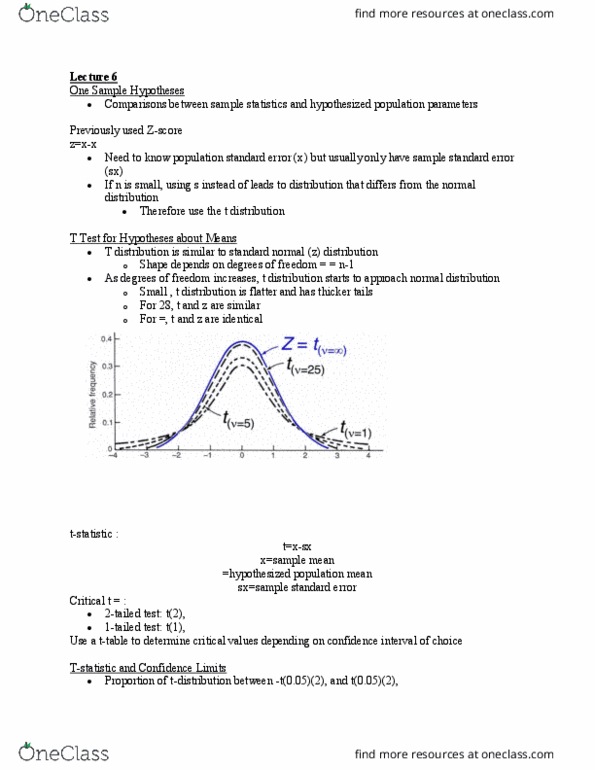
Student t-distribution: compares the mean of a random sample (from a normal pop) with a population mean proposed in a null hypothesis (cid:1872)= (cid:3042) (cid:1872)= (cid:3042) (cid:1871) / (cid:1866) (cid:1856)(cid:1858)=(cid:1866) (cid:883) =(cid:1871) / (cid:1866: t-distributions based on sample size large sample = normal t distribution the t-values become closer to a normal distribution as the sample size gets larger, sample size = = approaches normal. Small sample sizes increase the likelihood of having extreme value in the tails: assumptions of 1-sample t-test, the variable is normally distributed, the sample is a random sample. *can be either a 1-tailed or 2-tailed test but typically follows a 2-tailed test. 2-tailed: differences in either direction (aka above or below the mean) 1-tailed: differences can only be seen in a single direction. *the distribution is symmetrical so it does not matter whether you have a t-value that is + or they will draw the same conclusions.