PSYC 210 Study Guide - Midterm Guide: Average Absolute Deviation, Exploratory Data Analysis, Interquartile Range

15 Mar 2016
School
Department
Course
Professor
Document Summary
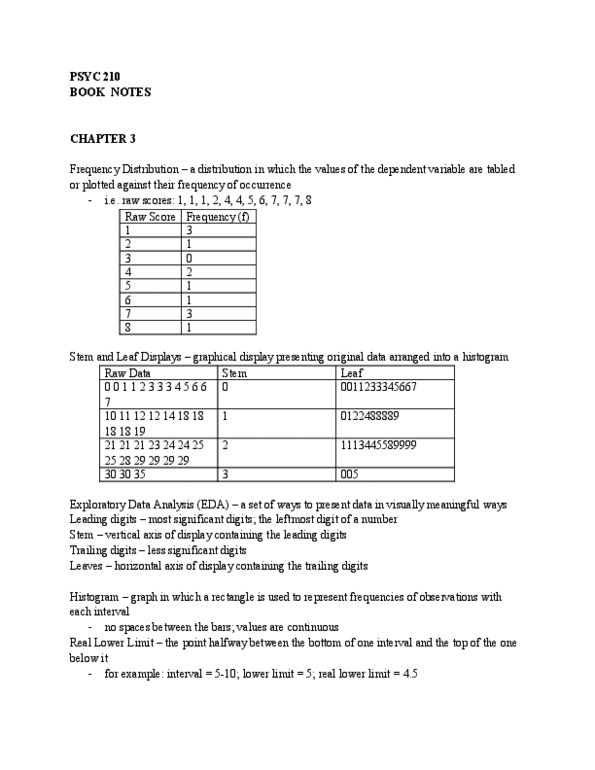
Decision tree: graphical representaion of decisions involved in choice of staisical procedures. Most staisical quesions fall into two overlapping categories: diferences versus relaionships. Exploratory data analysis (eda): set of techniques developed by tukey for presening data in visually meaningful ways (e. g. stem-and-leaf display) Leading digits: used in stem and leaf displays. Trailing digits: used in stem and leaf displays. Leaves: horizontal axis of display containing the trailing digits in the stem and leaf displays. Histogram: no gap between bars (vs. bar graph gaps) Real upper/lower limit: point halfway between top/botom of one interval and the one below/above it (e. g. if range was writen 10-19, it"d be 9. 5-19. 5) Modality: number of meaningful peaks in a frequency distribuion. Skewness: measure of the degree to which a distribuion is asymmetrical (not commonly used) Variability/dispersion: degree to which individual data points are distributed around the mean. Interquarile range: range of the middle 50% of the observaions (not possible scores)