STAT 101 Study Guide - Final Guide: Simple Random Sample, Squared Deviations From The Mean, Joint Probability Distribution

10 Mar 2014
School
Department
Course
Professor

Document Summary
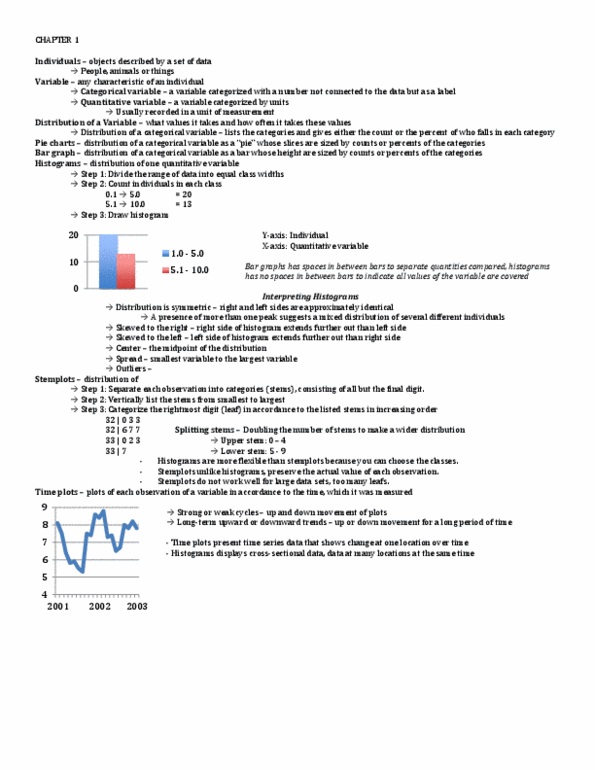
U = mean, o = standard deviation (1-z) area right: categorical variable: placed an individual categories. Quantitative variable: takes numerical values for which arithmetic operations such as adding and averaging makes sense. Distribution: tells us what value a variable takes and how often it takes theses values. Pie charts, bar graphs distribution of categorical variable. Histograms, stem plots distribution of quantitative variable. Shape: if the distribution has a single peak and if its skewed to the right or left. Variance: find the mean, the four deviations, the squared deviations, divide by (n-1: mean: all values and than divide by the number of observations. Mean of population = u, mean of sample = x_(over top) Quartiles: 1st at mark; 3rd at mark. Five-number summary: 1=min; 2=1st q; 3=m, 4=3rd q, 5=max. Interquartile range (iqr): distance between q1 and q3. (q3-q1=iqr) iqr*1. 5 = outliers. A resistant measure: unaffected by changes in numerical value.