SOC210- Midterm Exam Guide - Comprehensive Notes for the exam ( 83 pages long!)

11 Oct 2017
School
Department
Course
Professor
Document Summary
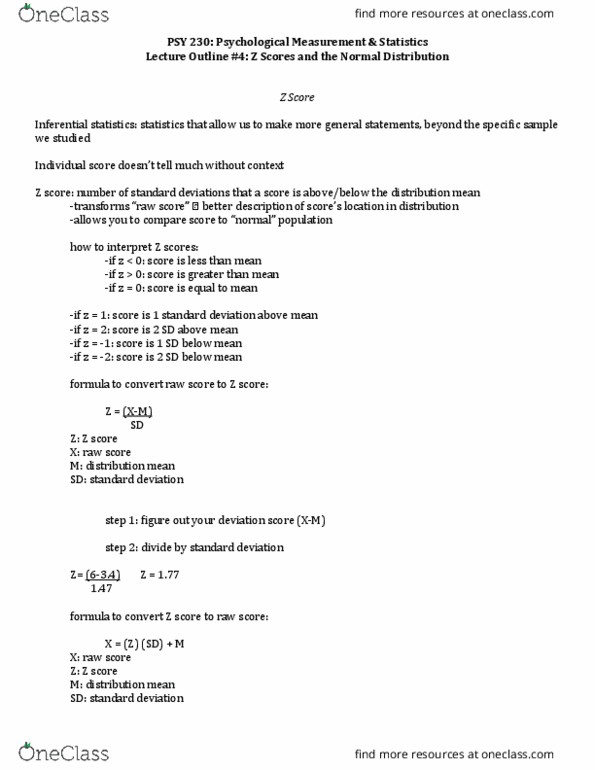
Examine the combined effects of more than one independent variable on a dependent variable. Soc 210 - lecture 4a - the normal curve. Characteristics table 1: symmetrical, mean, median and the mode are the same, the shape of distribution changes as the standard deviation (sd) changes, placement of the distribution changes as the mean changes; Notice: if the curve is not symmetrical, then it is not a normal distribution. Definition: the number of sd that a given raw scores is above or below the mean, formula changes a raw score (xi) to a z score. Where xi = the score, = the mean, = the standard deviation. You received a grade of 80 on a recent exam, the mean was 70. 07 and the. Sd was 10. 27, calculate your grade as a z score. Z = (80 70. 07)/10. 27 = 9. 93/10. 27 = 0. 97. You received a standardized grade of -0. 98 on a recent exam, the mean was.