[FARE 3310] - Midterm Exam Guide - Everything you need to know! (28 pages long)

7 Feb 2017
School
Course
Professor

Document Summary
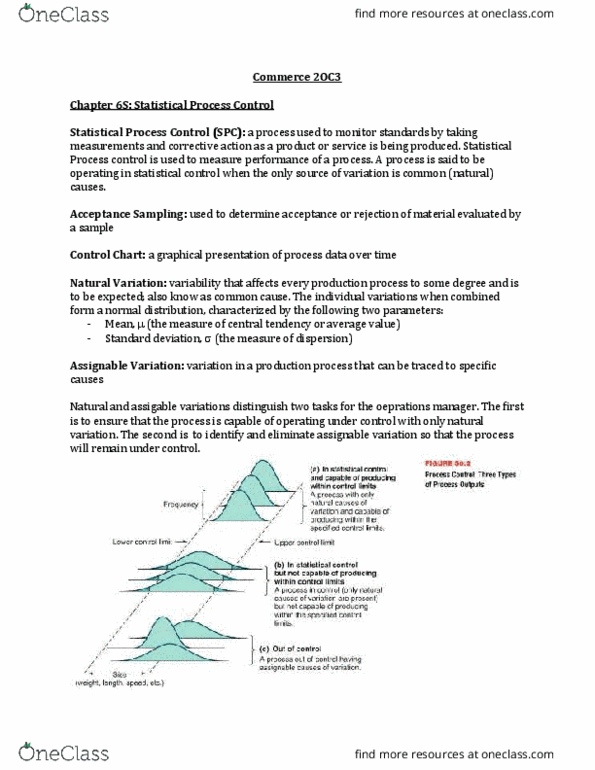
Control chart: graphical presentation of process data over time. Assignable variations: variation in production process that can be tried to speci c causes: ex. machine wear, misadjusted equipment, fatigued/untrained employees etc. Both variations distinguish two tasks for operations managers: ensure that the process is capable of operating under control with only natural variation. 2. identify and eliminate assignable variations to that the processes remain under control. A = found on table x = mean of sample means. Setting range chart limits (r-charts: concerned with process average and process dispersion or range, process average may be under control but the dispersion may not be. Using mean and range charts: normal distribution is de ned by the mean and the standard deviation, x-chart and r-chart mimic these parameters, x-chart is sensitive to process mean whereas r-chart is sensitive to shifts in process standard deviation. Steps to follow using control charts: colect 20-25 samples.