BIO4180 Study Guide - Quiz Guide: Simple Linear Regression, Linear Regression, Family-Wise Error Rate

14 Dec 2019
School
Department
Course
Professor
Document Summary
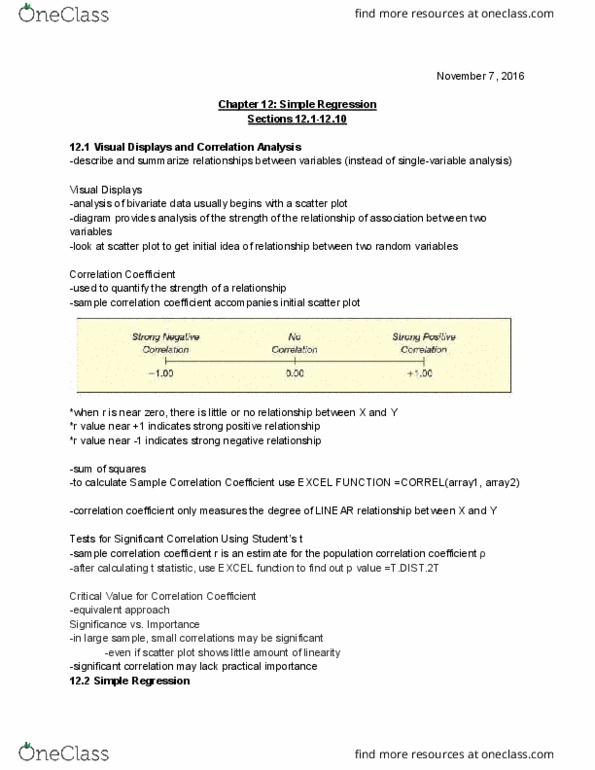
Correlation measures the strength between x and y. Might be better to do correlation of x1 and x2 since there is no independent/dependent. Simple linear regression: predicts y based on x, regression one way is not the same the other way. Graphs on the right go from strong positive/negative correlation, medium strength, non. The squared of the coefficient: proportion of variation in one variable explained by the variation in the other, goes in either direction since correlations go in either direction. Tests and quantify the effect of your dep. Change of y over change of x measure of raw effect size, slope, how intense is that relationship. The importance of the effect is given by r squared. Could be high correlation but low regression, independent concepts. For the sample correlation to be an unbiased estimate of the population, x values need to be chosen randomly. Non-random sampling biased estimate of the correlation of the population.