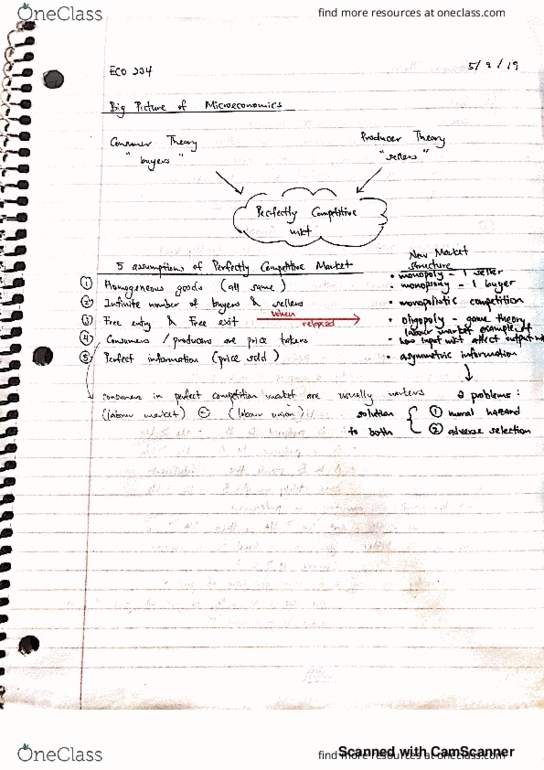
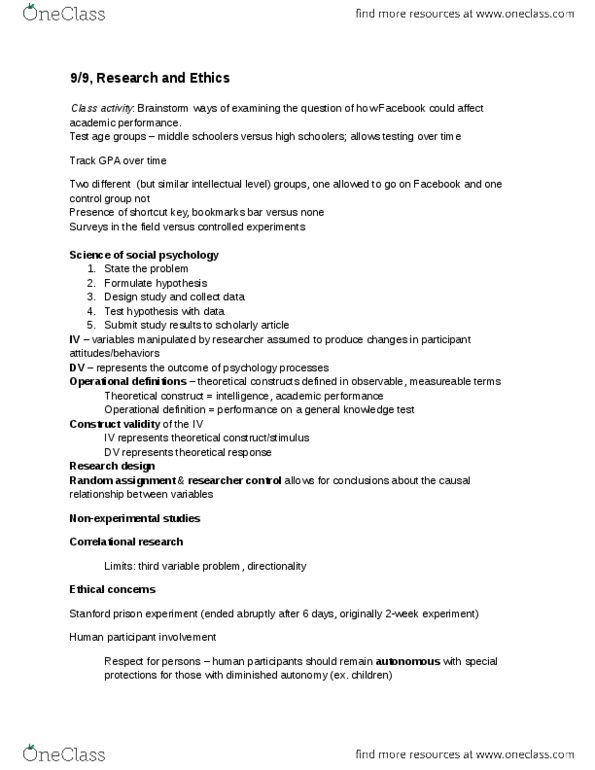
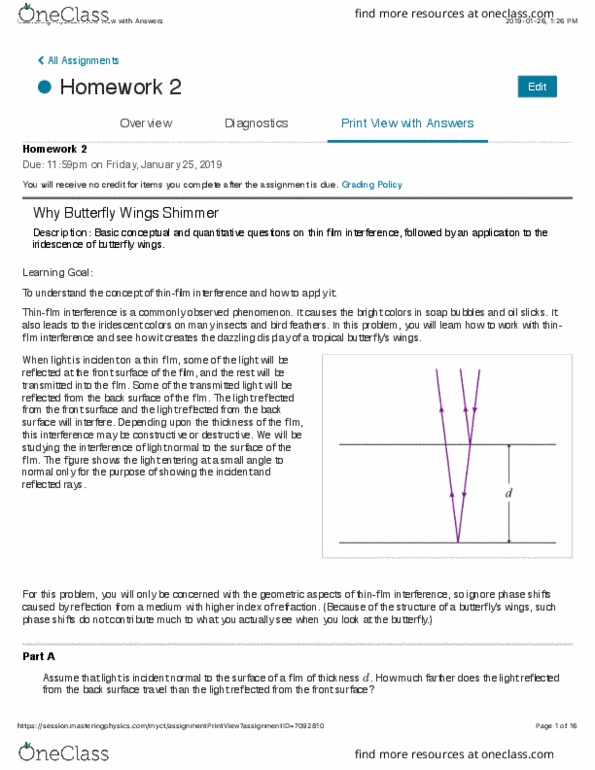
ECMB12H3 Lec 01, 30, 60
Quantitative Methods in Economics II
Department of Management
University of Toronto at Scarborough
Winter 2012
Dr. Yu
Test 2
Date: Friday March 16, 2012
Time allowed: Two (2) hours
Aids allowed: Calculator and one aid sheet (two 8.5”x11” pages) prepared by student.
Notes:
• This test consists of 22 questions in 10 pages including this cover page.
• It is the student’s responsibility to hand in al l pages of this test. Any missing page will get
zero mark.
• Statistical tables are provided separately. Do not hand in the tables. O nly hand in your test
papers.
• Show your work in each question in Part II.
• This test is worth 30% of your course grade.
Print Last Name Solution
Given Name(s)
Student Number
Circle your sectionL01 Tuesday L30 Wednesday L60 Online
Do not write on the space below, for markers only
Page Question Max Marks
2-5 1-17 51
6 18 9
6 19 10
7 20 10
8-9 21ab 10
10 22ab 10
Total 100
1 Part I. Multiple Choice. 3 points in each question. No part mark.
Circle only one answer. If there are more than one correct answer, circle the best one.
1. A random sam ple of 12 observations is se lected to estim ate a si mple regression
relationship of y depending on x. A partial ANOVA table is given below.
Source SS df MS F
Regression 17.8
Error 10
Total
Which one of the following statements is true?
(a) About 64% of the variation on y can be explained by x.
(b) The correlation between x and y is close ± 0.8
(c) About 80% of the variation on y can be explained by x.
√ (d) Only (a) and (b) are true.
(e) All (a), (b) and (c) are true.
2. Let X 1nd X be2the means of two independent random samples, each of size n, from
the respective populations N µ1,σ2 )and N µ ,2 2), where the common variance σ is
known. If the 90 percent confidence interval for1− µ 2 is X1− X ±2 /5, the value of
n is closest to
(a) 25 (b) 50 (c) 75 (d) 104 √ (e) 136
3. Two independent random samples are selected from two normal populations. The sample
statistics are summarized below.
Sample Size Mean Variance
1 25 7.30 1.6
2 25 6.80 1.2
In testing whether the m eans of two popul ations are equal or not, assum ing the
population variances are equal, the value of the test statistic is closest to
(a) 0.143 (b) 0.975 (c) 1.25 √ (d) 1.494 (e) 1.95
2 4. Let X and Y be the respective means of two large independent random samples, each of
⎛ σ σ ⎞
size n, from a population with variancσ . Suppose P ⎜− < X − Y < ⎟ =0.98, the
⎝ 2 2⎠
value of n is
(a) 28 (b) 32 (c) 36 (d) 40 √ (e) 44
Solution: When n is largeX follows N µ,σ /n and Y follows N µ,σ /n .)
2
⎜ 2σ ⎟ ⎛ σ σ ⎞
X −Y follows N ⎜, n ⎟ . Given that P⎝− 2 < X −Y < 2 ⎠=0.98, we get
⎝ ⎠
⎛ ⎞ ⎛ n n ⎞
P − σ /2 − 0 < X −Y − 0 < σ /2 −0 ⎟ = 0.98, P − < Z < ⎟ = 0.98.
⎝ 2σ 2 /n 2σ 2/n 2σ 2 /n⎠ ⎝ 2 2 2 2 ⎠
n n
From the standard norm al table, 2 2 = 2.33. Squaring both sides, 8 = 5.4289, and
n=43.43122. The answer is n=44.
∧
Questions 5–6, the sim ple regression line of Y on X is found to beY =10−0.8X based on
sample data. Suppose the variance of Y is 4 times the variance of X.
5. The sample correlation coefficient is
(a) − 0.8 (b)− 0.6 √ (c)− 0.4 (d)− 0.2 (e) none of these
6. The slope of the simple regression line of X on Y is
− 0.8 (b)− 0.6 (c)− 0.4 √ (d)− 0.2 (e) none of these
(a)
Questions 7–10, an ins urance company will o ffer discounts on its lif e insurance policies to
nonsmokers if the proportion of nonsmokers suffering heart disease is significantly lower
than that of the smokers. As part of their study, the company selects two large random
samples of nonsm okers and s mokers independently. The sa mple of 200 nons mokers
shows that 5% of them suffer heart disease.
7. Suppose the sample of smokers shows that 8% of them suffer heart disease, and the 95%
confidence interval for the d ifference in population propor tions is within 0.05. The
sample size on the smokers is closest to
(a) 165 √ (b) 179 (c) 208 (d) 217 (e) 250
3 Suppose the company ignores the result in question 7 and selects a random sample of 200
smokers as well. This sam ple shows that 8% of the sm okers suffer heart disease. Use
this additional information to answer questions 8–10.
8. A 95% confidence interval for the difference in proportion between nonsm
okers and
smokers is closest to
√ (a) − 0.03± 0.0482 (b) − 0.03± 0.0405 (c) − 0.03± 0.0502
(d) − 0.03± 0.0514 (e) − 0.03± 0.0533
9. The company wishes to test if the propor tion of nons mokers suffering heart disease is
significantly lower than that of the smokers. The p-value is closest to
(a) 0.01 (b) 0.05 √ (c) 0.1112 (d) 0.1522 (e) 0.3222
10. Denote the proportions of nons mokers and smokers suffering from heart disease by p1
and p2 , respectively. The com pany wishes to test the hypothesis H 0 p −1p = 2.02
verses H 1 p 1 p <20.02 . The value of the test statistic is closest to
(a) –1.219 (b) –1.645 (c) –1.96 √ (d) –2.032 (e) –2.33
Questions 11–12, the time for boys to com plete a certain task follows approxim ately a normal
distribution with mean 12 m inutes and standard deviation 3 m inutes, and the time for
girls to complete the same task als o follows approximately a norm al distribution with
mean 10 minutes and standard deviation 4 minutes.
11. A boy and a girl are s elected independently. W hat is the probability that th e boy will
complete this task in longer time than the girl? Circle the closest value.
(a) 0.3446 (b) 0.5 (c) 0.60 (d) 0.625 √ (e) 0.6554
12. A random sample of 25 boys is selected, and independently a random sample of 16 girls
is selected. What is the probability that the average time for the 25 boys to complete this
task is longer than the average time for the 16 girls? Circle the closest value.
(a) 0.4525 (b) 0.6554 (c) 0.714 (d) 0.85 √ (e) 0.9564
4 Questions 13–15, the rising price of petroleum products has led to continually increasing costs to
the manufacturer for shipping goods to the market. In a study of shipping costs ( Y in
dollars) and distance (X in 100 kilometers), a random sample of 9 observations gives the
following summarized results.
Mean Standard Deviation
X 20 5
Y 80 25
The correlation coefficient between X and Y is 0.7.
13. If the distance increases by 100 kilom eters, the expected increase of shipping co st is
closest to
√ (a) $3.5 (b) $5.0 (c) $6.5 (d) $8.0 (e) $9.5
14. In the ANOVA table, the value of MSE is closest to
(a) 180.22 (b) 203.11 (c) 230.15 (d) 312.44 √ (e) 364.29
15. What is the estimated shipping cost when the distance is 2200 kilometers?
(a) 75 √ (b) 87 (c) 95 (d) 103 (e) none of these
Question 16–17, let X1and X be2two independent random samples, each of size 50, from the
same population with mean µ and variance 9.
16. Which one of the following has approximately a standard normal distribution?
5 3
(a) X1− X 2 √ (b) 3(X1− X 2) (c)5 X 1 X 2)
(d) 1(X1− X 2 ) (e) none of these
3
17. The probabilityP X − X >1 is closest to
1 2
(a) 0.001 (b) 0.005 (c) 0.01 √ (d) 0.0475 (e) 0.0975
⎛ 1 0 ⎞
Solution: P X1− X 2 1 = P⎝Z > 9/25 ⎠= P Z >1.67 = 0.0475
5 Part II Show your work in each question.
18. (9 marks)
2
Let S be the variance of a random sample of size 6 from the normal distribution with
mean µ and variance 12. Find
More
Less