PSY201H1 : Textbook notes from Statistics for the Behavioural Sciences - applicable to spring or fall term

Document Summary
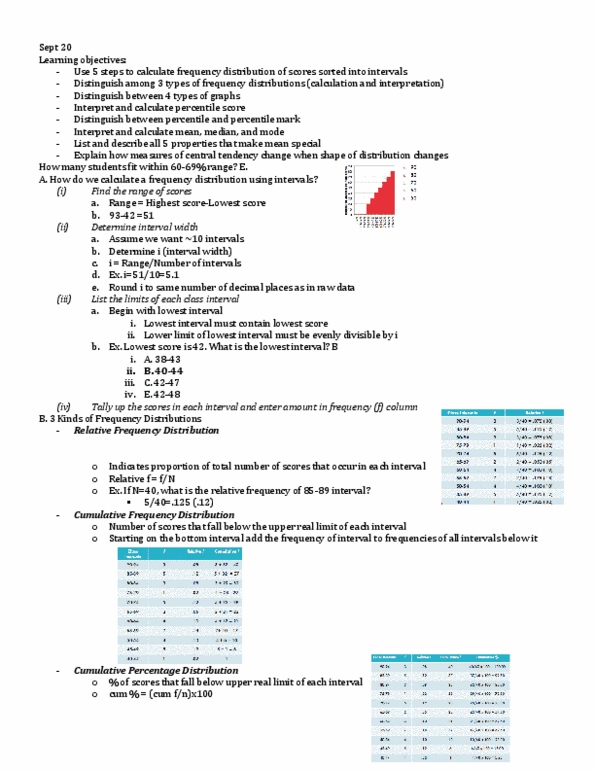
2. 1 frequency distribution: an organized tabulation of the number of individuals located in each category on the scale of measurement. Allows experimenter to see how the individual scores are distributed on a measurement scale. First column: x (measurement categories) organized from highest lowest. Second column: f (frequency of occurrences of each category) To find x 2 from this: square each of the scores and add these values. add each x value multiplied by its corresponding f. Proportion: measures fraction of total group that is associated with each score. Can be added as a 3rd column of a basic table, as p p = f/n. Percentage: describe distributions of scores by associating each score with a percentage of occurrences. Can be included in a basic table, as % Used when the data set covers a v. wide r ange of values. Class intervals: groups of scores (as opposed to individual values of the basic fd.