RSM270H1 Study Guide - Midterm Guide: Gantt Chart, Total Factor Productivity, Process Flow Diagram


Document Summary
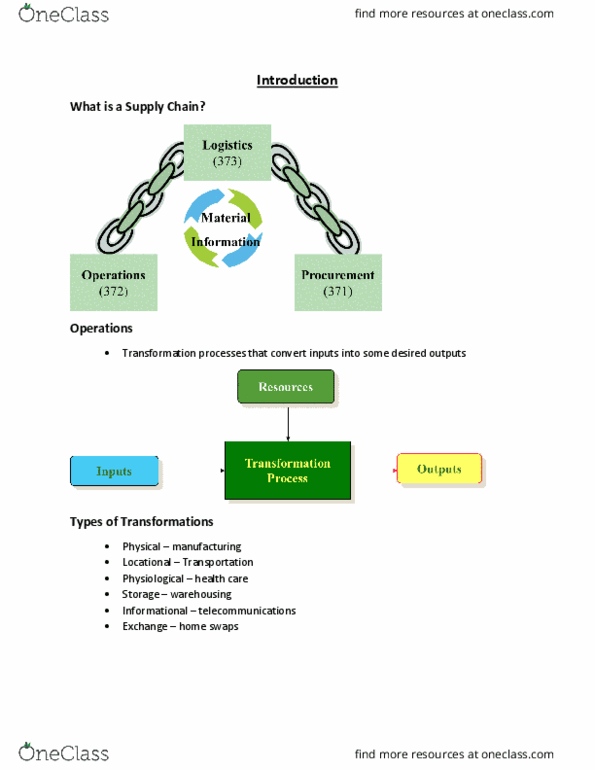
Operations management: the design and management of systems to make products, provide services and deliver them to the end user. Operations management is the management (design, operation, and improvement) of the transformation processes that create value (= quality / price). Om is the management of this core activity of any organization: creation of goods and services. Outputs are a combination of product and service. Process: a set of tasks that transform inputs into outputs. Buy + make/create + sell + move: supply chain management. Efficiency: doing something at lowest possible cost. Effectiveness: doing the right thing to create most value. Example: bank: efficient: using fewest people possible at counter, effective: minimize time customers need to wait. Productivity is a common measure on how well resources are. Multi-factor measures of productivity= output/(labor + capital + material) Total factor productivity (tfp) includes all factors of production = output/(all input)