Biology 2244A/B Study Guide - Final Guide: Dependent And Independent Variables

26 Dec 2019
School
Department
Course
Professor
Document Summary
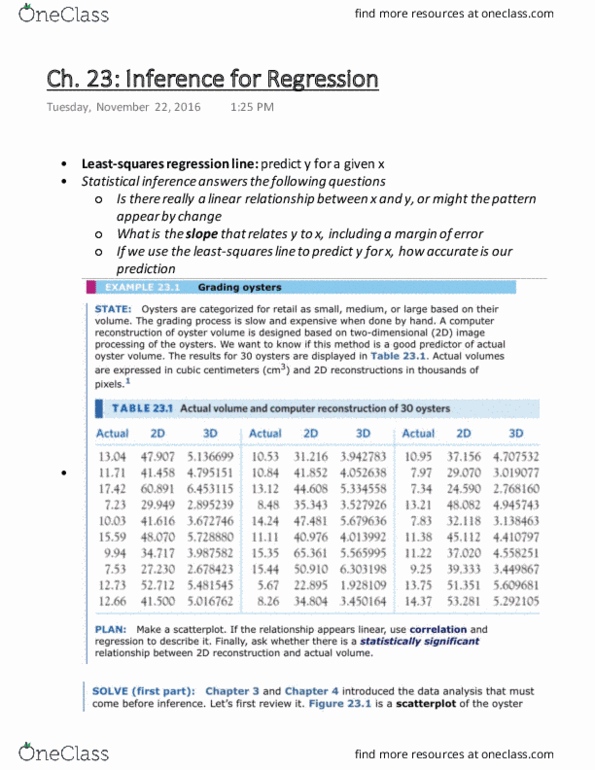
O n between of explanatory the relationship and response (quantitative) variables. Determines the variations in the response variable that can be explained by the relationship with the explanatory variable. How much of a response is due to. Relationships in bivariate data the explanatory variable of interest given only. If given sample data , cannot say for sure if a relationship exists sampling error population data can say relationship or not (no sampling error) F o r: b is the slope parameter. Response variable observations are independent study 1 sampling designs. Constant s. cl . relationship between explanatory cx) and response (y) scatter / residual plot is normally distributed for each x q - q plot of residuals of for each x residual plot response ( and . Model : describing y based on x by when individual - O r slope error term (by - y) I * is lighter than average at 185cm.