Health Sciences 3801A/B- Midterm Exam Guide - Comprehensive Notes for the exam ( 17 pages long!)

11 Oct 2017
School
Department
Course
Professor
Document Summary
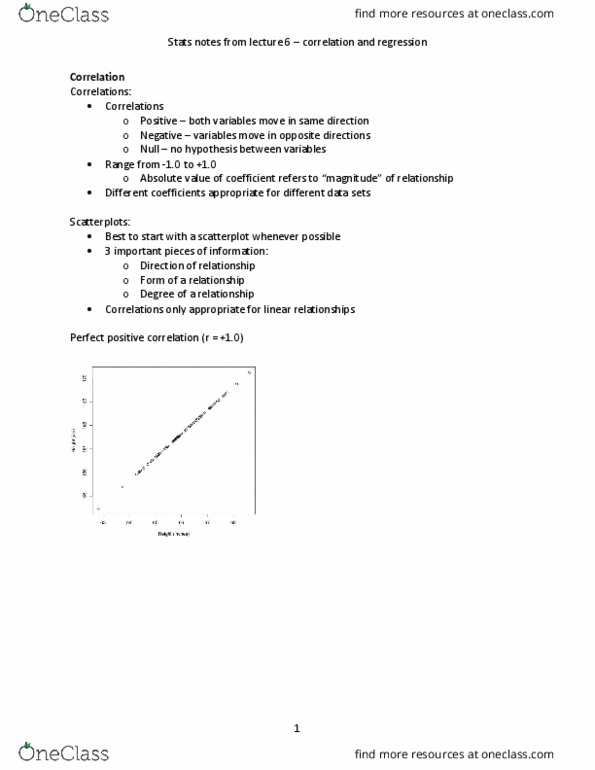
H e a l t h s c i e n c e s 3 8 0 1 a / b. Scatter plot visual representation of relationship between two variables. Positive relationship when increase in one variable is associated with increase in other variable. Negative relationship when increase in one variable associated with decrease in other variable. Straight line has general form y = a + bx: a is constant, b is slope of the line, x is the independent variable. Role of independent variable is to predict scores on dependent variable. These predicted scores are labelled y" to distinguish from actual observed y scores. Therefore, equation for regression line is y" = a + bx. Observed relationship between y and x should be written as y = a + bx + e: e is residual/error between predicted score and observed score, calculated by subtracting predicted score from observed score (y" y)