Statistical Sciences 2244A/B Study Guide - Final Guide: Simple Random Sample, Venn Diagram, Sample Space

22 May 2018
School
Department
Professor

Stats 2244
Probability
INTRODUCING PROBABILITY
- You want to assess the dating habits of the students at your school
- The question is: what is the average cost of a typical weekend date?
- The avg cost of a typical weekend date for the students at your school is a POPULATION MEAN
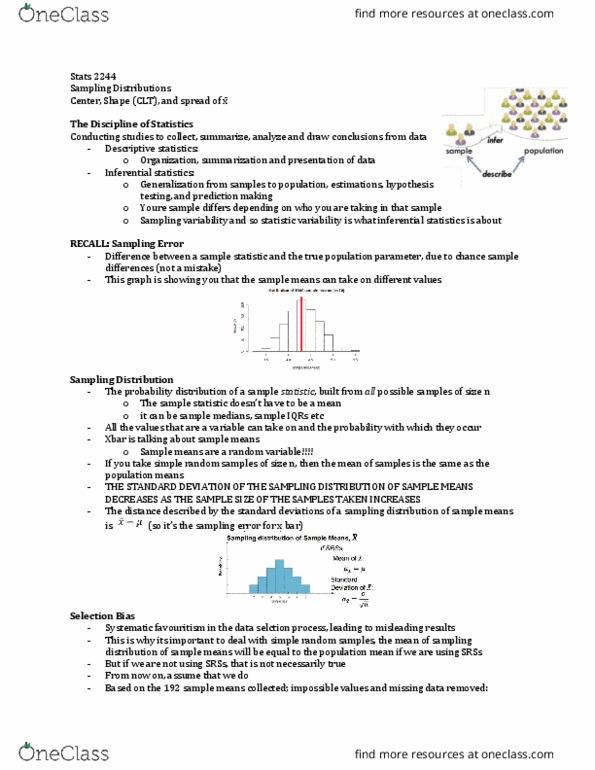
- Take a simple random sample of size n=50, compute x bar and infer to all students
- Can x bar from a simple random sample reliably tell us the avg cost of a typical date? Depends on
variability
- If we take a second simple random sample, would we get the same value for x bar? No – xbar
varies from sample to sample
- Bc chance is used to choose simple random samples, the laws of probability govern the
behaviour of sample statistics
- Note: larger samples with smaller variability give better estimates of population parameters –
bc the larger sample includes more of the possible values in the population of interest
- Random phenomenon:
o Event whose outcome we cant know in advance w complete certainty but that has a
regular pattern of occurrences over many repetitions
o To quantify how likely it is for a particular random phenomenon to occur we use
probability
o The probability of any event is the proportion or percentage of times it would occur in a
long series of repetitions or trials
o To represent the probability of an even occurring, we create a probability model
▪ Shows all the possible outcomes of a random phenomenon and the probability
of each outcome occurring
- Ex: coin toss:
o 2 outcomes: heads or tails
o the probability of one of the outcomes occurring is 50% or 1 in 2
o expressed as a proportion of all possible outcomes, any event (like a coin toss) has a
probability of occurring that lies bw0 and 1
o the closer the probability of an event lies to 1, the more likely the even is to occur
o the close the probability of an event lies to 0, the less likely to occur
o if the probability lies at 0.5, neither outcome is more or less likely to occur than the
other
Probability: Overview and Motivation
- probability:
o # bw 0 an 1 that describes the likelihood of a random event occurring
o a probability can also be thought of as a long-run proportion of times that the event
occurs
- ex: dice
o if you roll a dice, you could either get a 1,2,3,4,5 or 6
o whats the probability of the event of rolling a 4?
o There is 6 possible outcomes of your dice, but there is only 1 way to get a 4
o SO the probability of rolling a 4 is 1/6
- If the probability that we roll a 4 is 1/6 then 1 out of every 6 rolls should be a 4 right? Kind of – 1
OUT OF 6 ROLLS WILL BE A 4 IN THE LONG RUN
Probability Models
find more resources at oneclass.com
find more resources at oneclass.com