EC255 Study Guide - Midterm Guide: Bar Chart, Contingency Table, Cumulative Frequency Analysis


Document Summary
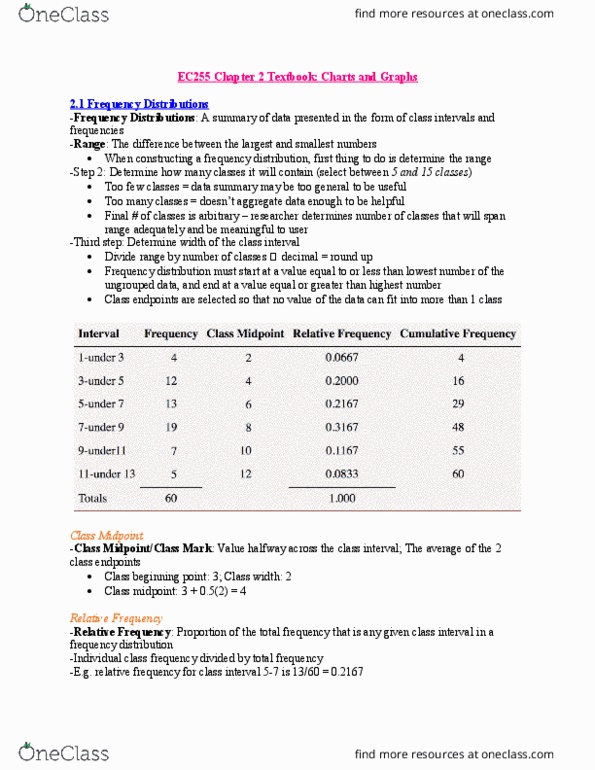
Chart containing two or more categories along one axis and a series of bars, one for each category, along the other axis. For any given class interval of a frequency distribution, the value halfway across the class interval; the average of the two class endpoints. A process for producing a two dimensional table that displays the frequency counts for two variables simultaneously. A running total of frequencies through the classes of a frequency distribution. A summary of data presented in the form of class intervals and frequencies. A graph constructed by plotting a dot for the frequencies at the class midpoints and connecting the dots. Data that have been organized into a frequency distribution. A type of vertical bar chart constructed by graphing line segments for the frequencies of classes across the class intervals and connecting each to the x axis to form a series of rectangles.