EC285 Study Guide - Midterm Guide: Conditional Probability, Univariate, Ordinary Least Squares

Document Summary
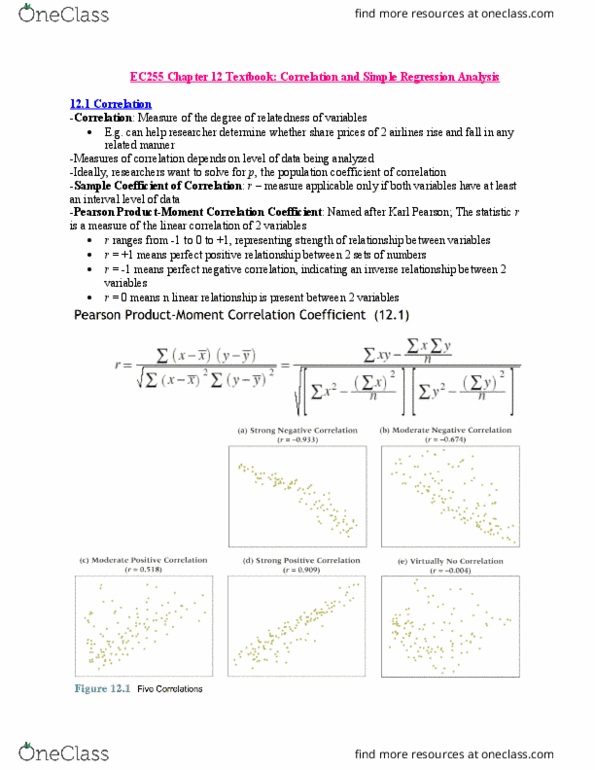
Measures of linear relationship: covariance, coefficient of correlation, regression analysis. Regression line b1 = m = slope of line of best fit tell you how many units y would be expected to change on average given 1 unit increase in x. Ordinary least squares (ols: a way of finding estimates for m and b, by drawing the line that minimizes the sum of squared residuals. 2 points on the line of best fit (0,100) (5,5) Slope = dy / dx = (-95/5) = -19. Equation of the line = 100 19n. Estimating m and b in y = mx + b. Sample statistics are estimates of the population parameters. Bi-variate for each x data point, there is a corresponding y data point. Sample standard deviation = sq. root of the distance from each data point to the sample mean, squared. Calculating correlation coefficient r" for a set of bi-variated data.